
Introduction: Air Taxi Charter Marketplace and Real-Time Flight Quotes
We are Flapper, an Air Taxi charter marketplace. Our great competitive advantage is that we have proprietary technology for on-demand and real-time flight quotes available to our +20K users through the website and mobile app.
When I joined the company, the scenario was one of lack of control and predictability in the activities of the technology team. The evolution of the company's product is intrinsically connected to the high decision-making capacity and the rhythm, efficiency, and predictability of its engineering team. In both cases, Flapper had an urgent need to improve the visibility of prioritized demands and ensure that such demands were executed. At the same time, there was a growing difficulty in ensuring product stability, evolution, and fast delivery from the team.
Challenges Faced: Technology Team Challenges and Lack of Workflow Management
The main challenges were:
- Complaints about product instability and lack of evolution;
- Lack of visibility of the work (to be done and accomplished);
- Items entering development based on the team members' affinity, rather than the business needs;
- Non-existent or disregarded work process;
- Requests coming through multiple channels, without prioritization and without everyone's knowledge;
- Many activities started and not completed;
- Switching activities due to urgency and lack of focus;
- Lack of alignment with the business;
- Operational activity delivery time exceeding 2 months;
- Low quality in product delivery, creating a range of waste and rework.
Initial Steps and Analysis: Applying STATIK and Choosing Businessmap for Workflow Management
Initially, it was necessary to understand the reality of the company and the possible causes for the problems initially encountered. Therefore, we made the following decisions:
- Interviews with all areas of the company to gather their dissatisfaction with the product and the team.
- Application of STATIK to map processes, demand origins, pain points, etc.
Based on the information collected, we needed something more robust to understand our problems. At this point, we realized that a major issue involved not only the lack of consistent practices for workflow management but also a tool that could support our needs, such as measuring and quickly analyzing efficiency metrics like time and delivery rate, bottlenecks, etc. For this, we chose Businessmap to start this work.
With the support of our partner Mindset Ágil, we migrated historical data from the previous tool to get an idea of our metrics, and we encountered the following situations:
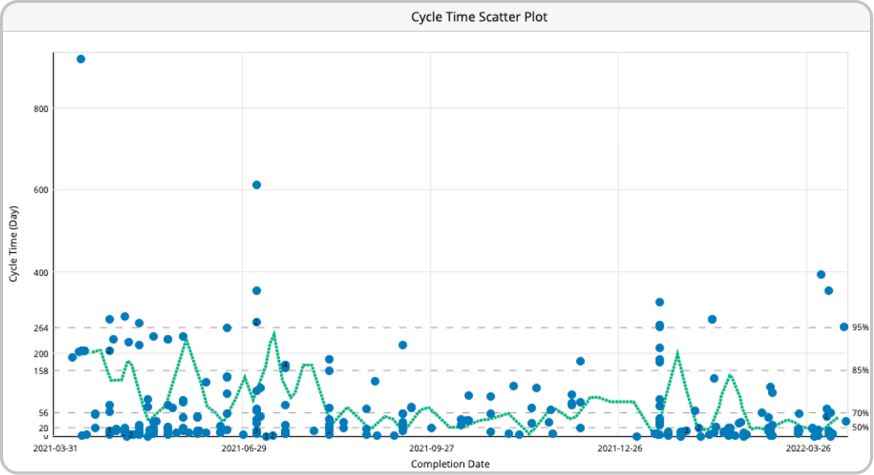
- Delivery time (cycle time) exceeding 250 days (85%), generating dissatisfaction in several departments and the board of directors.
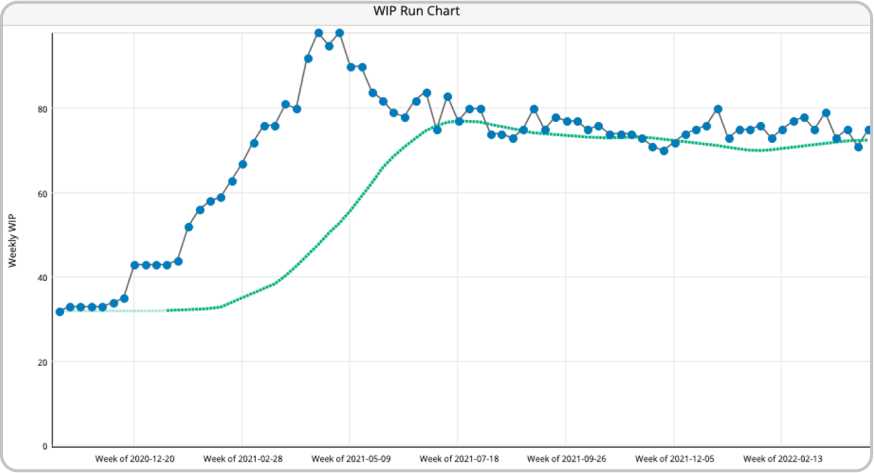
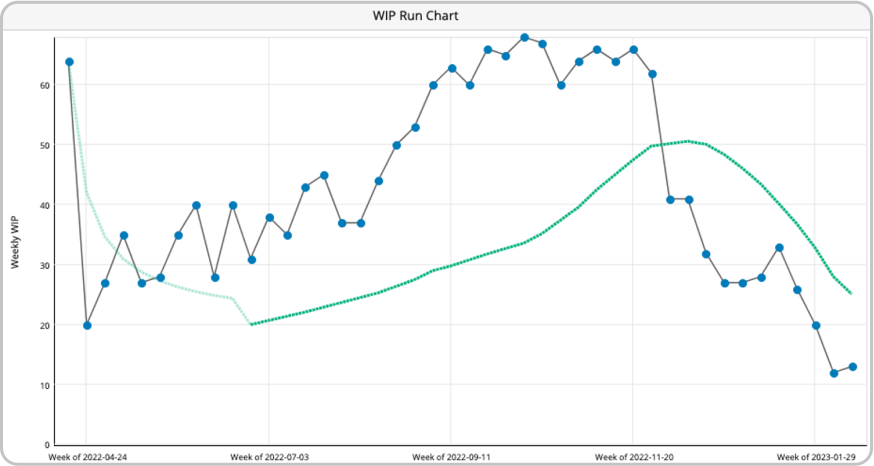
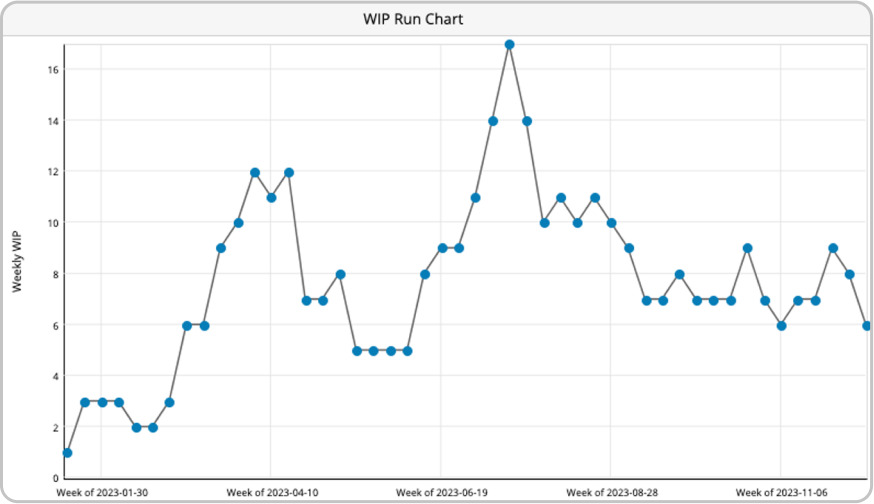
- Work in progress is consistently high, with an average WIP (Work In Progress) of 80 items per week.
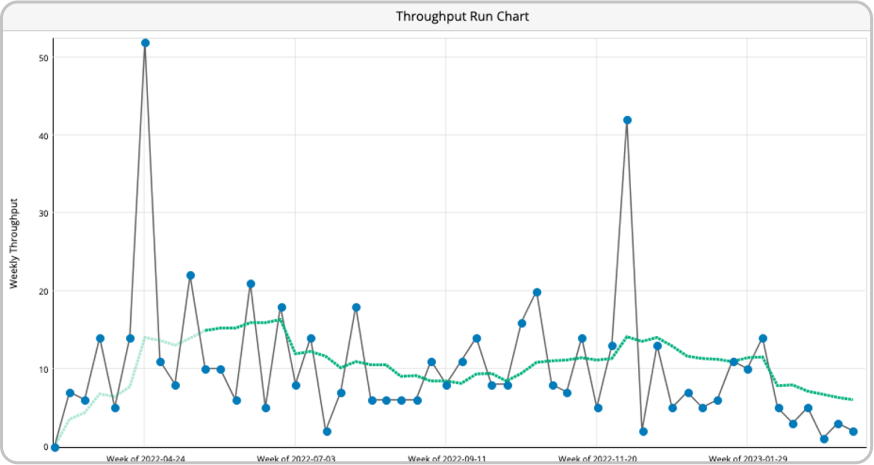
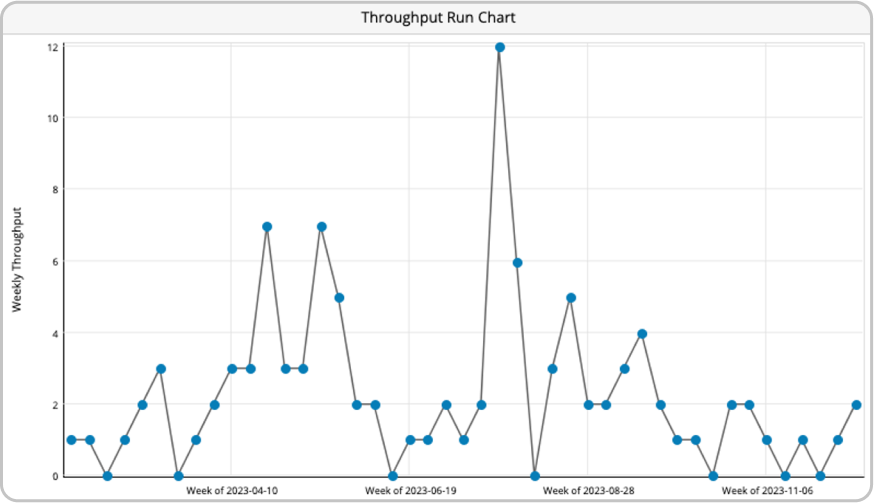
- Unstable throughput, which hindered our predictability and capacity measurement.
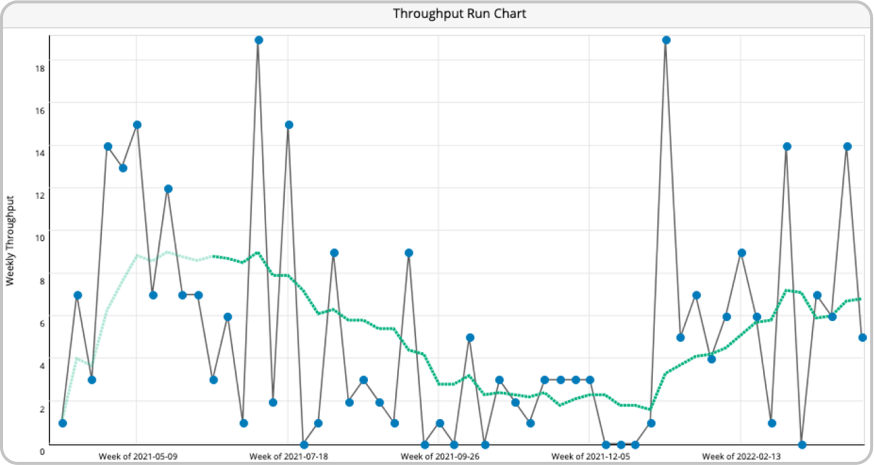
Although there was an average throughput of 6 items per week, the delivered items were developed randomly, without prioritization or connection with the business.
Implementation of New Practices: Workflow Adjustments and Prioritization Policies
With the introduction of a more comprehensive tool, we were able to implement various new practices that helped us achieve the results obtained:
- Adjustments to the workflow - as accepted by the team - to include missing steps and queues that were not measured;
- Periodic measurement of metrics, with increased visibility of queues, blockages, and priorities;
- Development of prioritization policies to ensure that the demands entering were the most important.
- Centralization of demands, ensuring that they arrived through a single channel of contact, thus organizing the workflow of the team for better visualization.
- Visibility of the end-to-end flow;
- We created initial policies - which evolved over time - to limit work in progress, one of the major offenders of our inefficiency;
- We also created automation within the tool that could expose potential bottlenecks and overdue items.
Results Achieved: Cycle Time Reduction and Throughput Improvement
After a few months of operation, we conducted a new analysis to organize the work better and more accurately represent dependencies between teams.
As a result, we now have connected boards that represent each team's work, with an organization that allows each individual to have a clear view of dependencies and potential blockages.
We began to quickly notice improvements in metrics and the perception of delivery time, dropping from over 150 days in delivery time, to 122, then to 90 days, and 60 days, and so on.
There were still several items that remained as "outliers" in the process, which were soon eliminated, as they were more complex or had deeper issues that had previously been invisible to us. 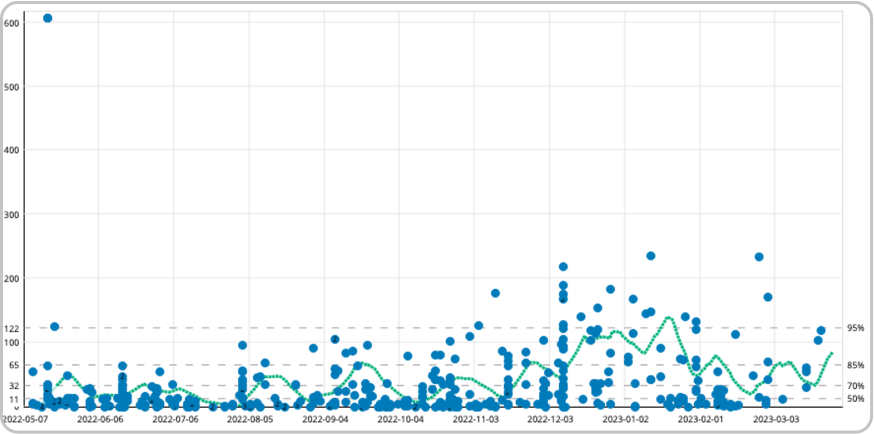
The team's throughput also began to vary less, increasing the team's confidence in their predictions and planning.
Immediately, the average WIP also dropped, exposing the practice of limiting work in progress as an effective solution to our problems.
Today, after incorporating the process and adjustments we made throughout 2022/2023, we have much more control of the process and its outcomes.
The team's metrics have greatly improved and stabilized, which enables us to identify and understand extraordinary situations when we experience any type of unusual behavior.
Today, despite delivering a smaller volume of items per week, the items are fully connected to the business and properly prioritized.
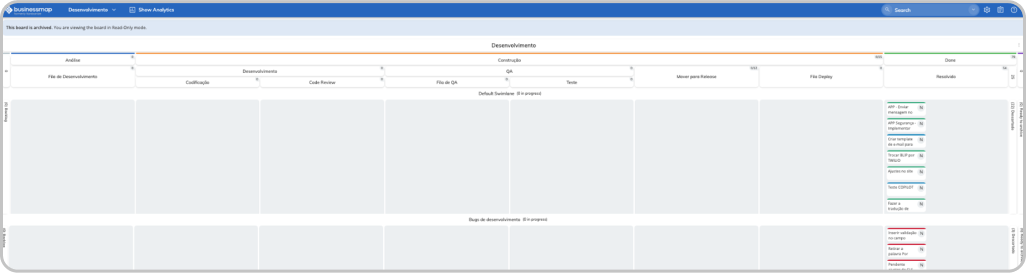
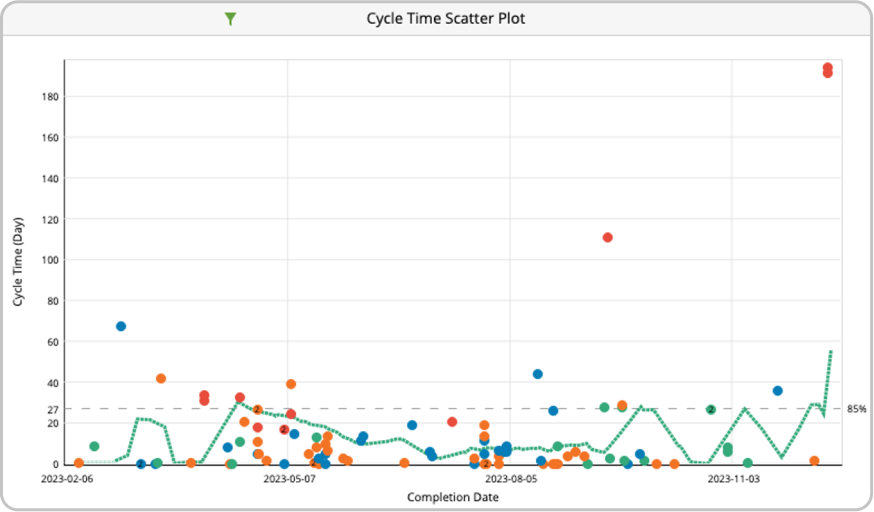
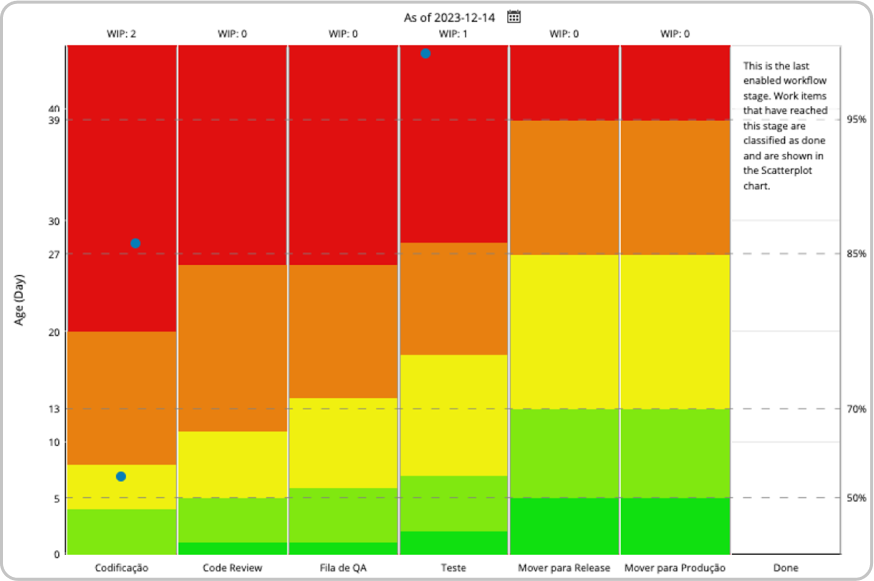
The Aging WIP chart is very useful in conducting daily meetings and understanding the reasons for changes in metrics. In the case below, we have 2 large features being developed from scratch, with significant changes to the system architecture, which do not adhere to the type of demand that the team typically works on.
All these changes are reflected in the satisfaction of the technology team, and especially in the perception of the company's departments and clients regarding the work that has been carried out. Today there is a perception that the product is stable, and we have recently started implementing a new, improved version that encompasses more services.
A Summary of the Results
Here's an in-depth look at the significant outcomes we achieved through our improvements:
- Immediate visibility of work in all areas but especially for the team;
- Changes in flow metrics: Cycle Time = 27 days, WIP = 10 items/week, stable Throughput of = 2 items/week (despite the lower average, rework decreased drastically, showing that defects also made up this metric);
- Predictability of deliveries, especially after the adoption of Monte Carlo simulations for planning;
- Greater focus on fewer activities and, consequently, increase in quality;
- The team is interested and suggesting changes in the flow;
- Understanding and internalization of the idea of flow and its components;
- Perception of value by the business.
Ongoing Improvements: Predictability in Delivery and Workflow Maturity
- The goal is still to reach a TC (Cycle Time) of 15 days;
- Continue improving the maturity of the flow.
Conclusion: Business Process Improvement and Enhanced Product Stability
The Businessmap tool greatly aided us in materializing the volume of work being done and helped steer this effort toward the right activities. This enabled the team to deliver more and better, more aligned with the business and the needs of our client. This change was noticed by the entire company.
Want to achieve the same results?
Book a Product Demo