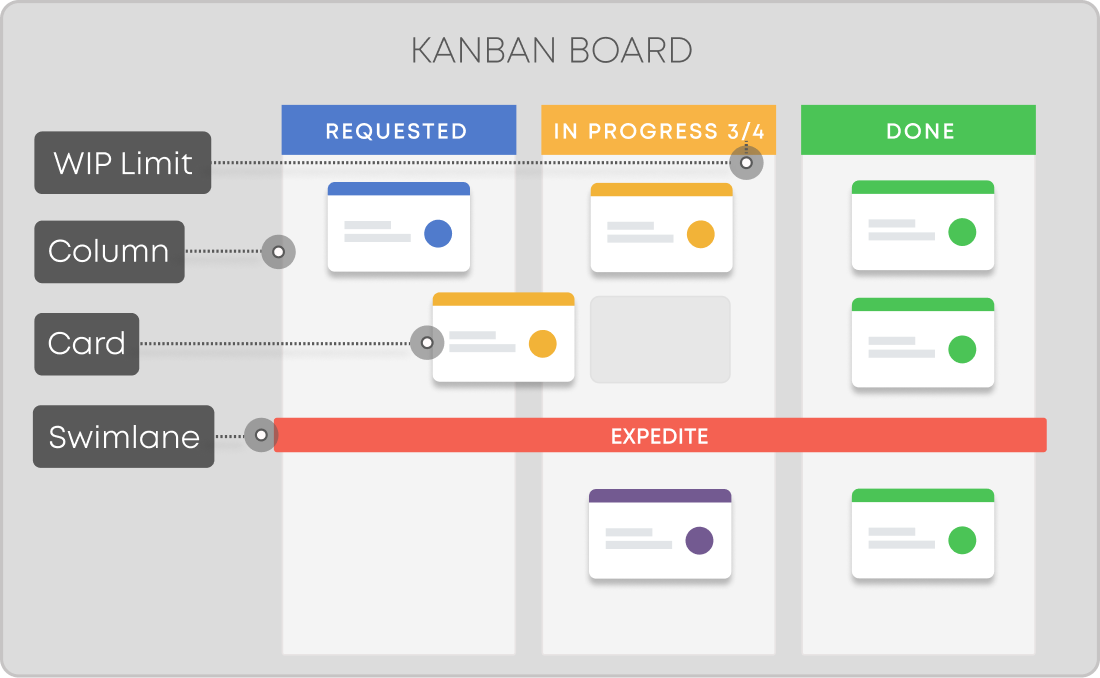
Of all the teams I've worked with on our product, almost everyone sees the Kanban board as a genius way to visualize work and move it faster. To make the invisible visible, to show what's in progress and what's next. And they're right. That's exactly what Kanban does on the surface. But there is more to Kanban project management than what meets the eye.
If you spend enough time handling complex projects using Kanban boards, you start to notice that the board shapes the conversations you have with your team.
How do we decide what moves forward?
Who gets to make that call?
What trade-offs are we quietly making when we move one card before another?
For many people, those questions seem outside the board's scope. They see Kanban as an operational aid, not a decision tool. Maybe, if you're lucky, the project manager senses the potential of Kanban as something more than a workflow chart, something closer to a governance system in disguise. But for everyone else, it's just a map of tasks.
That difference in perspective between how we see Kanban and what it can actually tell us is what this article is about.
Kanban: Beyond WIP and Throughput
The longer you work with Kanban in product cycles, the more you see that WIP limits and throughput are necessary but shallow indicators. They clean up the surface: fewer half-started stories, steadier movement across the board, nicer charts at the end of the week. On the surface, they don't explain why a team that's "within WIP" can still feel unpredictable, or why throughput collapses even when everyone looks busy.
The reason is that Kanban, as a project management framework, integrates multiple schools of thought. It borrows from:
- Systems thinking, which treats feedback as a structural element
- The flow optimization and value-focused practices of lean principles
- The analytical insights of queuing theory (particularly around batch size, throughput, and queue length)
- The study of variation and predictability from statistical process control, and
- The discipline of continuous improvement and quality management.
Together, these ideas turn Kanban from a scheduling tool into a model of how complex systems learn and adapt.
When you start viewing Kanban through this multidisciplinary lens, it stops being a tool for tracking tasks and becomes a system for improving the quality of decisions.
Every project is a series of decisions. Every card, every column, every policy is a feedback mechanism, revealing how your team prioritizes, sequences, and responds to uncertainty. The same principles that govern how work moves (limiting WIP, managing queues, reducing variability) also shape how decisions flow through a system.
Long feedback loops or missing information are all signs of the system's decision-making capability starting to decay. Kanban's genius lies in making these invisible slowdowns visible.
Feedback loops in Kanban
The magnitude of this issue is significantly concerning. According to the Standish Group CHAOS Report, large projects generate an extraordinary number of decisions - roughly one decision for every $1,000 of labor cost. Each delayed choice adds coordination overhead, fragments context, and compounds uncertainty across the board.
Understanding Decision Latency and Its Cost
Decision latency is the time between recognizing that a decision is needed and actually making it. Every project has hundreds of these moments, where progress depends on someone making a decision. In Kanban, these decisions often appear as invisible queues: cards stuck in columns like "Awaiting Clarification," "Pending Approval," or "Ready for Review."
The waiting time builds up and hurts predictability. According to Little's Law (WIP = Throughput × Cycle Time), when waiting increases, both cycle time and work in progress (WIP) go up, and throughput goes down. In other words, decision latency increases delays and slows output - even when people seem busy.
You can see this in unusually wider bands in Cumulative Flow Diagrams, or inconsistent cycle-time plots where some cards move fast while others stay stuck for days. Meanwhile, the aging or work-item age metric reveals where items have stalled - often not because of technical blockages but because a decision hasn't landed.
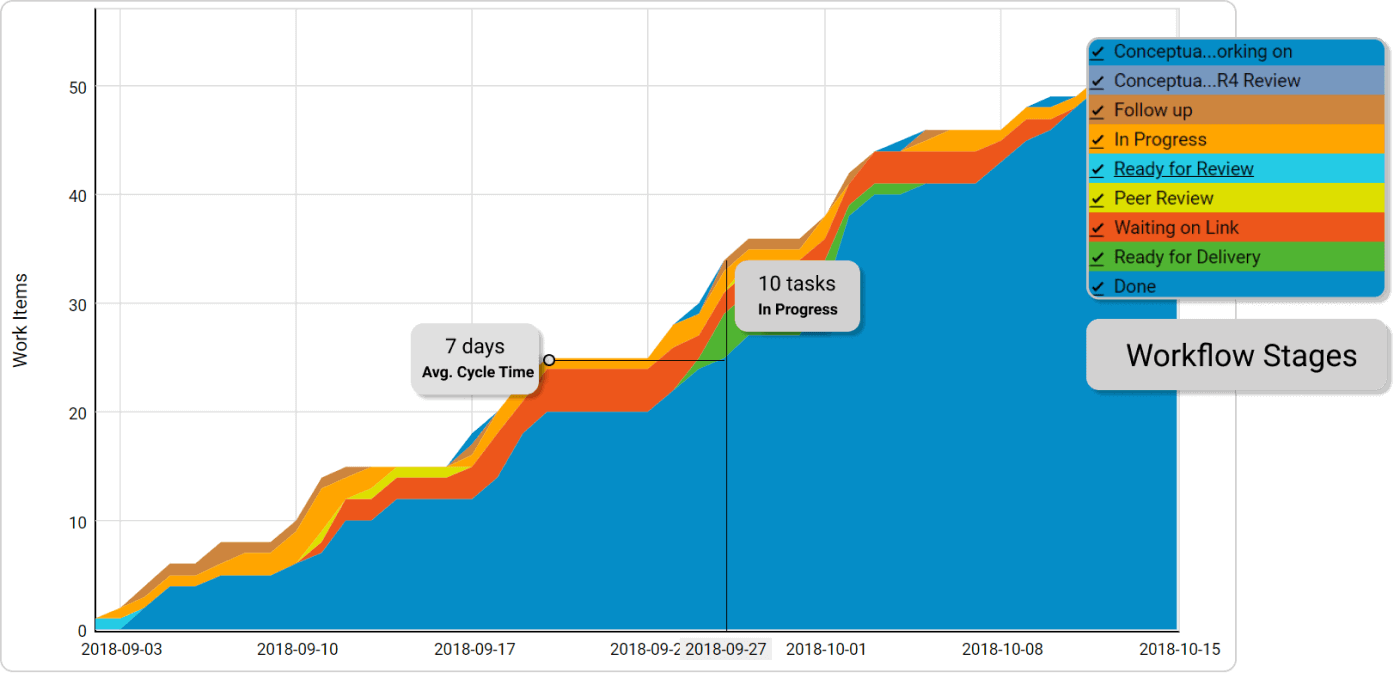
Cumulative flow diagram and work stages of a process
The real cost, however, is both monetary and systemic. Just as codebases accumulate technical debt, your project can accumulate decision debt from the unmade choices that clutter the Kanban space. Each postponed decision adds coordination overhead, multiplies context loss, and amplifies the variability.
The CHAOS Report also shows that faster decision-making strongly correlates with success. Teams that keep decision latency under one hour have about a 58% success rate, while those that take five hours or more drop to around 18%. In short, slow decisions don't just delay progress, they dramatically reduce your chances of success while increasing the cost of your project.
Because decision points scale with project size, the cumulative impact becomes proportional. A single delayed decision may just block downstream work, but dozens of smaller delays multiply across parallel flows, fragmenting predictability and increasing context-switching overhead.
To reduce decision latency, teams need to design for it, not just observe it. Every delay on your board has two parts: the visible one (a card waiting) and the invisible one (a decision not yet made). By exposing both, you can identify where the real bottlenecks are and start managing decision flow as deliberately as you manage workflow.
Visualizing the Flow of Decisions
Once decision latency becomes visible, the next step is to measure and visualize it. Treating it as part of the flow reveals a second layer of dynamics beneath the visible Kanban stream.
At ProofHub, we began by tagging any card waiting on a decision with a label called "Blocked by Decision" (BBD). Alongside our regular workflow, we built a decision flow map that captured how these waiting points moved - or didn't - through the system.
When we plotted a simple cumulative flow diagram for the tagged cards, patterns quickly emerged. Approvals in QA and product reviews formed consistent queues. Some items oscillated between "waiting" and "in progress", revealing small rework loops that were previously invisible. Decision-aging graphs made the impact tangible - showing how even short stalls compounded into broader project delays once critical-path items were blocked.
At first, we assumed our existing WIP limits would prevent such buildup. After all, Little's Law tells us that stabilizing WIP should stabilize throughput. But the data told a different story.
WIP limits controlled the number of active tasks - not the number of pending decisions. Cards could sit neatly within our WIP boundaries yet remain frozen because no one had moved the decision forward. The board looked calm, but progress had quietly stopped.
That realization shifted our focus: we needed a way to make decision latency as explicit as task progress.
We then mapped these insights using Value Stream Map (VSM). Every handoff, approval, and clarification became a node for analysis. This allowed us to ask concrete questions:
- Which decisions could be turned into explicit policies or automated triggers?
- Where could WIP limits, queue constraints, or classes of service help reduce bottlenecks?
- How would these changes shape a future-state VSM for the next quarter?
By asking these questions, Kanban evolved from a task board into a decision-control system aligned with strategic flow.
Designing for Decision Flow
Making decisions visible was only the first step. Visibility shows where friction exists, but it doesn't remove it. To truly improve flow, we had to design how decisions move - how they're triggered, escalated, and resolved. Without that structure, visualization alone would highlight the same problems, week after week.
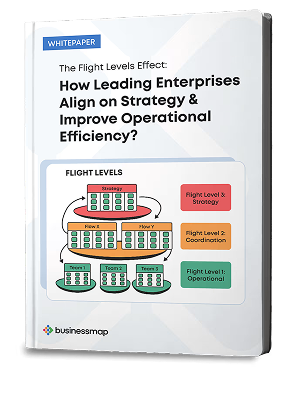
This is where Kanban began to evolve for us from a workflow visualization tool into a decision architecture that could scale across levels of the organization.
We started by mapping not just work items, but the decision points themselves - grouped across three distinct Flight Levels.
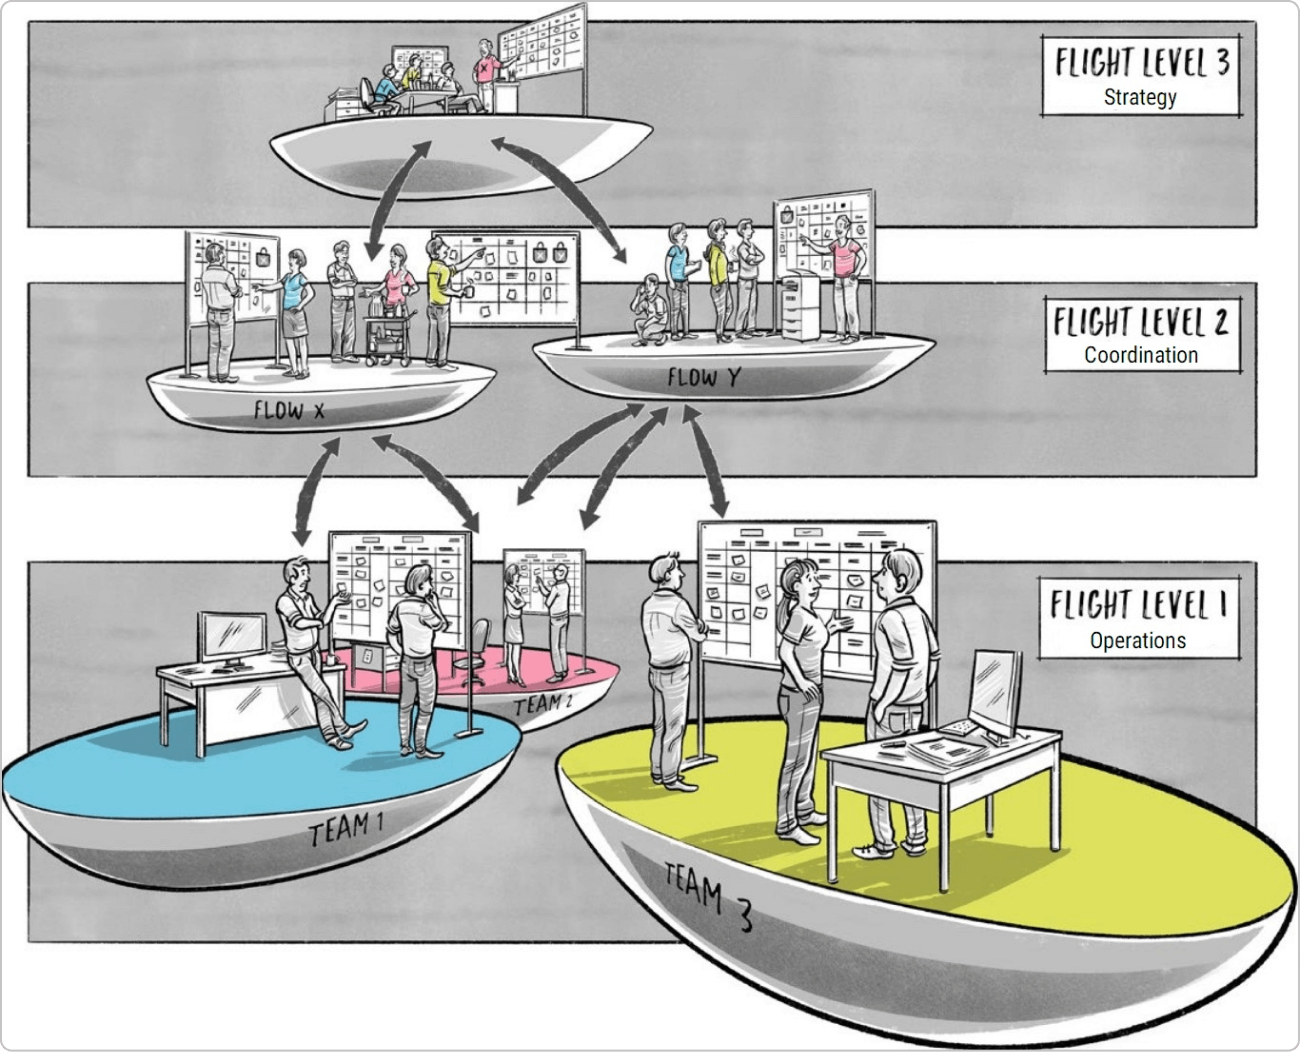 Image credit: https://www.flowsphere.ch/en/
Level 1: Operational / Execution Decisions
These are the everyday calls that keep work unblocked - design approvals, code reviews, or content edits. On our board, any card waiting for such input is tagged [DECISION: UX Approval] and tracked in a small "Awaiting Decision" column. Aging indicators on these cards turn yellow after two days, signaling early warnings before the delay spreads elsewhere in the flow.
This simple visual cue changed behavior. Instead of quietly waiting, teammates began proactively nudging decision-makers, reducing small but costly stalls in daily execution.
Level 2: Coordination / Cross-Team Decisions
At this level, decisions affect multiple teams - API contracts, sprint sequencing, or integration plans. These are not local choices; they require shared alignment.
We visualized them by linking dependent cards across boards, so a waiting decision in one area automatically referenced its dependent items elsewhere. When one team's work was blocked, the related teams could immediately see it rather than discovering it days later in a status meeting.
We also established a policy to expedite the queue for blockers on the critical path and batch limits to prevent overloading decision-makers. This level of transparency reduced coordination lag.
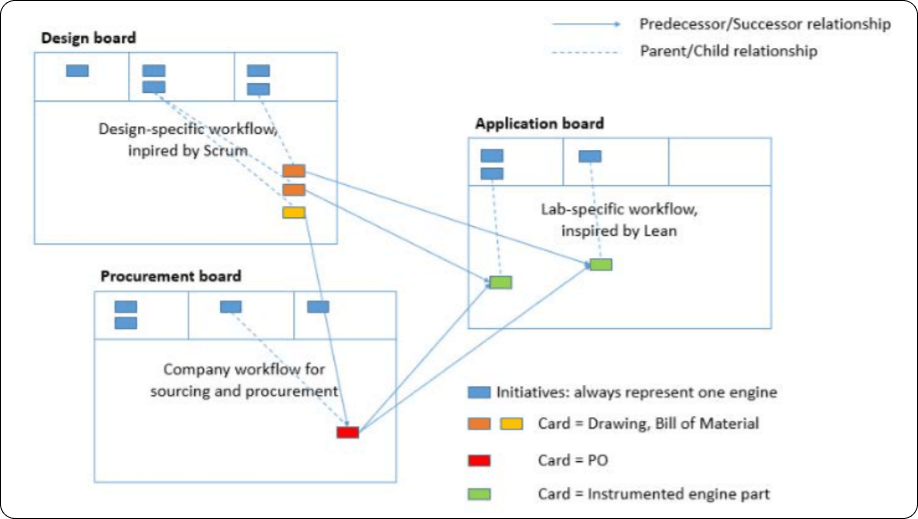
Connected cross-functional Kanban boards
Level 3: Strategic Decisions
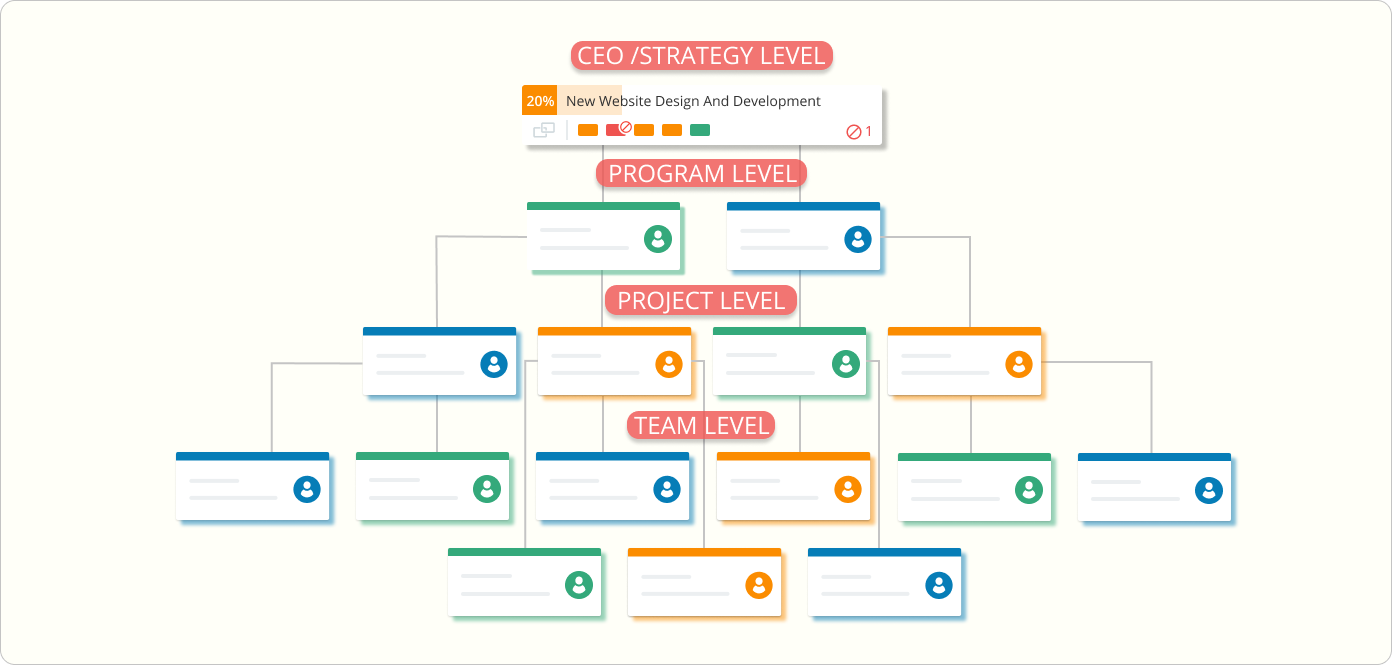
These are the high-level decisions: initiative prioritization, release timing, and resource allocation. We represented them as cards in a dedicated dashboard, each showing ownership, class of service, and decision age. This view made it possible to see which strategic calls were overdue - and how their latency cascaded down to execution levels.
By visualizing strategic decisions in the same system, we could finally connect the dots between leadership intent and team progress.
Aligning these three levels created coherence across timescales. When decisions at one level outpaced or contradicted another, work oscillated - teams moved forward only to pause for re-alignment. By synchronizing decision flow, we reduced those oscillations and built predictability into the system itself.
Policy Design for Decision Flow
After visualizing Flight Levels, we began codifying decision policies directly in the Kanban system. These policies defined how decisions were owned, aged, and escalated.
- Explicit Ownership: Every decision-requiring card must have a named decision-maker assigned before it enters a waiting state.when the same person appeared as the blocker across multiple cards, you can identify a capacity constraint that needed addressing.
- Decision Aging and Escalation: A time-based policy that flags and escalates decisions that remain unresolved beyond defined thresholds. This prevents decisions from quietly rotting in the backlog while everyone stays busy with "more important" work.
- Classes of Service (CoS): Decisions classified as Expedite, Fixed-date, or Intangible inform prioritization and pull sequence. It helps you balance urgent decisions with predictable, lower-priority approvals.
- Dependency Mapping: A visual representation of how decisions relate to and block other decisions or work items across the system. This creates a network view of decision dependencies, revealing critical paths.
- Experimentation and Feedback Loops: Retrospectives focus not just on task delivery but also on decision-making efficiency.
When these principles work together, decision flow becomes self-correcting. Teams can sense where attention lags, act before delays compound, and continuously adjust the balance between structure and freedom.
Businessmap is the most flexible software, helping your company gain visibility across all projects/portfolios, align on goals, and deliver quality work faster.

Sandeep Kashyap
ProofHub Founder
Meet Sandeep Kashyap, the CEO of ProofHub, who is transforming project management and team collaboration with his innovative solutions. With an unwavering passion for leading his team to success, Sandeep's mantra is simple - "Keep growing, don't stop". When he's not busy at work, Sandeep loves to explore new destinations and challenge himself with trekking adventures.