In today’s dynamic and competitive business landscape, quickly adapting to changes is crucial for survival and success. Within this context, the term "Agile Transformation" has gained significant relevance, becoming a central topic in discussions about organizational modernization.
But what does an Agile transformation truly entail?
An Agile transformation is a profound process that involves adopting Agile principles and practices at an organizational level. The goal is to enhance a company’s ability to respond swiftly and effectively to market and customer needs. This concept, which began to take shape in the early 2000s with the publication of the Agile Manifesto, has transcended its origins in software development to encompass all areas of an organization, from project management to leadership and corporate culture.
Often, Agile transformation is perceived as a fleeting trend, just another "buzzword" in the vast world of business management. However, its growing adoption and the tangible results it has delivered to companies of all sizes and sectors demonstrate that it is far more than a passing trend. Business agility has become an effective response to the volatility, uncertainty, complexity, and ambiguity (VUCA) that characterize today’s environment.
As more organizations embark on this journey toward agility, a key question arises: How do you measure an Agile transformation? Understanding and quantifying the impacts of this process is no simple task, as it involves evaluating both qualitative and quantitative changes in how a company operates and addresses its challenges.
This article will explore the most effective metrics and approaches to measure the success of an Agile transformation, providing a clear framework to guide organizations on their path to greater agility.
Understanding the Purpose
As the title of Simon Sinek's book suggests:
Start with Why
Beginning with a clear and well-defined purpose is crucial when discussing Agile transformation. The "why" behind the transformation is the driving force that propels all efforts and unifies the entire organization around a shared vision.
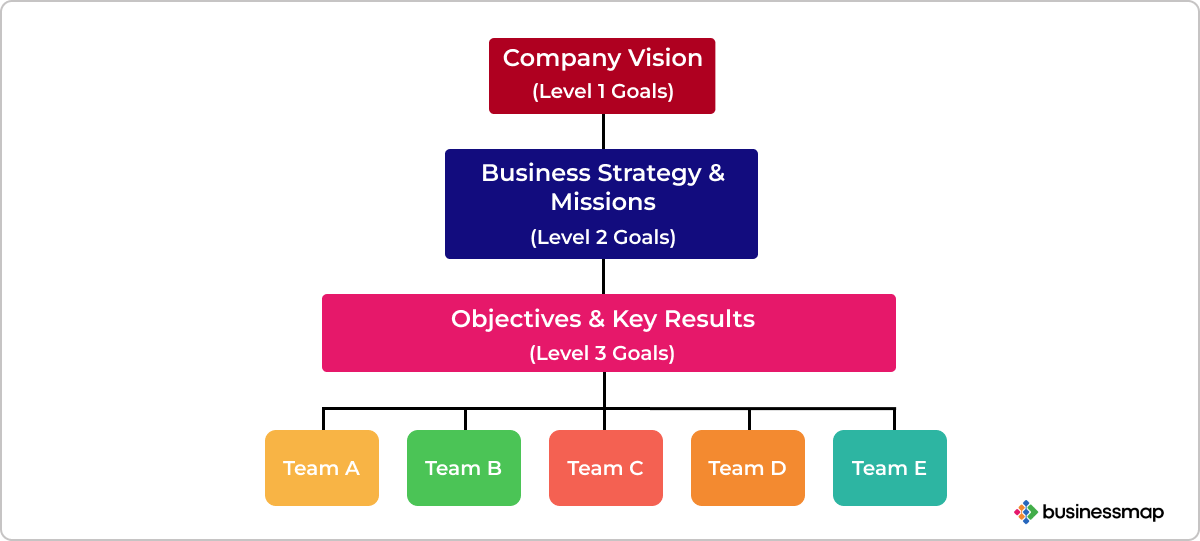
Without a clear purpose, change initiatives risk becoming fragmented efforts, lacking direction and sustainability in the long term. Understanding the "why" clarifies the goals to be achieved and instills a sense of meaning and even urgency among teams, fostering genuine commitment to the transformation. Ultimately, this purpose will guide strategic decisions and enable the true success of the Agile transformation to be measured.
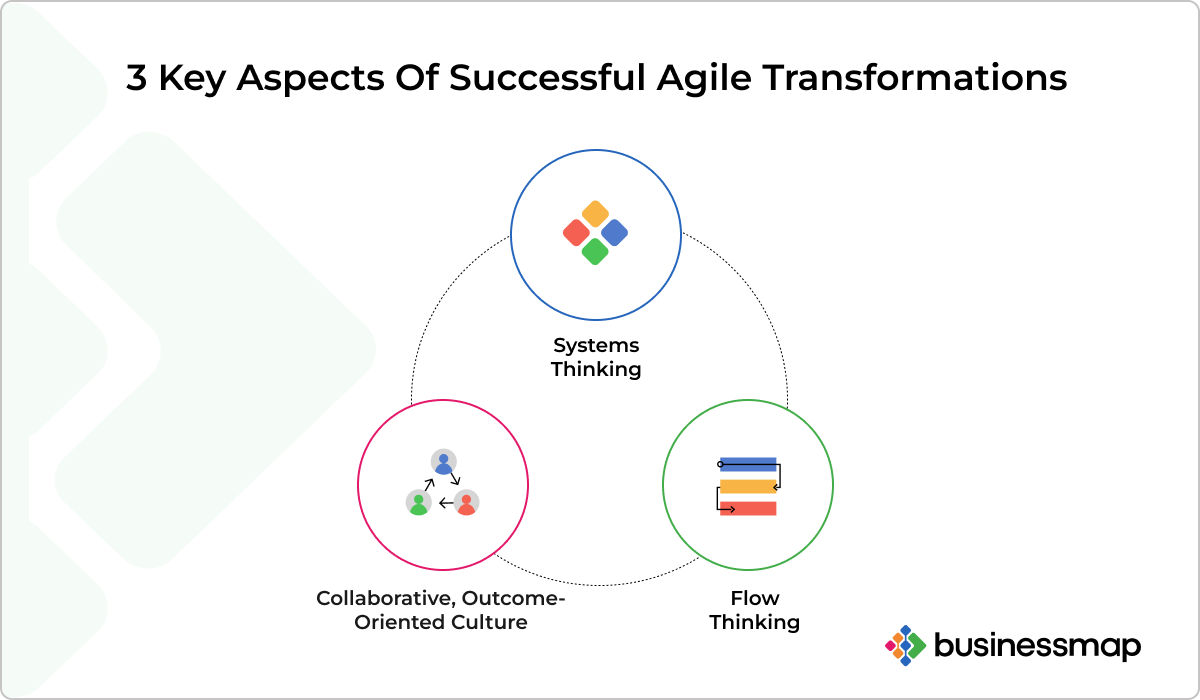
While each company will have its answer to the “why,” our experience suggests that these answers can generally be grouped into three distinct areas:
- The Customer and the Market
- The Product
- The Company (and its Culture)
How Will We Measure the Success of the Agile Transformation?
Spoiler: There is no single, perfect way to measure your company’s Agile transformation.
The first and quick answer to this question is simple: we just need to return to the previous question—why do we want to transform? Using the answer to that question, we can orient ourselves on measuring success.
Before defining the various metrics for measuring Agile transformation, a preliminary consideration is that we must establish outcome-oriented metrics, not just production metrics.
Let’s explore which metrics can help us in each of these dimensions.
Customer and Market-Related Metrics
If our primary objective is:
- Building lasting relationships with customers: "delighting customers."
- Reducing time to market.
- Becoming market leaders.
Some useful metrics in this area include:
Customer Satisfaction
- Number of times (per week) team members talk to an actual customer: This metric measures the frequency of direct interactions between team members and customers, providing insights into how well the team understands and responds to customer needs.
- Net Promoter Score (NPS): The metric gauges customer loyalty by asking how likely customers are to recommend a company’s product or service to others, typically on a scale from 0 to 10.
- Retention (DAU/MAU): This metric compares the number of daily active users (DAU) to monthly active users (MAU), indicating how well a product retains its users over time.
- Referrals: This metric tracks the number of new customers acquired through recommendations from existing customers, reflecting customer satisfaction and advocacy.
Market Responsiveness
AARRR (Acquisition, Activation, Retention, Referral, Revenue):
- Acquisition: Measures how effectively a company attracts potential customers or users from the market.
- Activation: Tracks how well the company or product delivers initial value to users, leading to their first successful interaction.
- Retention: Assesses how well the company keeps users returning over time, indicating responsiveness to ongoing needs.
- Referral: Reflects the extent to which satisfied users recommend the product to others, demonstrating the company's ability to exceed market expectations.
- Revenue: Measures how effectively the company converts its user base into paying customers, indicating market fit and value perception.
HEART (Happiness, Engagement, Adoption, Retention, Task Success):
- Happiness: Captures customer satisfaction and emotional response to the product, reflecting how well the product meets or exceeds market needs.
- Engagement: Measures how actively and frequently users interact with the product, indicating responsiveness to user desires and market trends.
- Adoption: Tracks how effectively new users start using the product, showing the product's appeal and relevance in the market.
- Retention: Evaluates the product’s ability to keep users over time, indicating long-term value and market responsiveness.
- Task Success: Assesses the ease with which users complete key tasks, reflecting how well the product meets functional market demands.
Product-Related Metrics
If our goal is to improve our products from the perspective of:
- Better service/product quality.
- Innovation.
Some useful metrics in this area include:
Product Innovation
- Market Share: Measures the percentage of total sales in a market that a product or company holds. From an innovation perspective, increasing market share indicates that the product successfully meets customer needs and outcompeting alternatives. A growing market share often reflects successful innovation, where new features, products, or business models have resonated with the market.
- Number of Validated Business-Level Hypotheses Developed and Tested: This metric tracks the number of hypotheses related to business strategies that have been systematically tested and validated. These hypotheses might concern customer needs, pricing models, or product features in product innovation. Validating such hypotheses through experimentation is crucial for guiding the innovation process, ensuring product development is based on actual data and insights rather than assumptions.
- Number of Failed Experiments: Measures how many innovation attempts did not produce the expected results. In product innovation, many failed experiments are often positive, as they indicate a willingness to take risks, explore new ideas, and learn quickly. Each failure contributes valuable insights that can guide the product development process and increase the chances of success in subsequent iterations.
Product Quality
- Defects in Production: The number of bugs or issues found in the product after it has been released to customers. This metric indicates the quality of the product and the effectiveness of the development and testing processes.
- Change Fail Percentage: The percentage of product changes or updates that result in production failures or issues. This metric measures the stability and reliability of the development process, particularly how well changes are managed and implemented.
- Ratio of Fixing Work vs. Feature Work: The ratio comparing the time or effort spent on fixing bugs and issues to the time spent developing new features. This metric helps assess how much of the development effort is focused on maintenance versus innovation.
Company and Culture-Related Metrics
The third area in which we may find our primary objective is company culture. The objectives pursued might align with the following:
- Employee Engagement.
- Committed Teams.
- Better response to environmental changes.
- Continuous Improvement.
- Improved Predictability.
- Increased Productivity.
Some useful metrics in this area include:
Employee Engagement
- eNPS (Employee Net Promoter Score): A measure of employee satisfaction and loyalty, calculated by asking employees how likely they are to recommend their workplace to others. A higher eNPS indicates a more engaged and satisfied workforce.
- Bad Turnover: The rate at which high-performing or critical employees leave the organization. High turnover can indicate employee satisfaction, management, or company culture issues.
- Employee Referrals: The number of new hires from existing employees' recommendations. High rates of employee referrals suggest a positive workplace culture and that employees are satisfied enough to recommend the company to others.
- Offer Acceptance: The percentage of job offers that candidates accept. A high offer acceptance rate indicates that the company is attractive to job seekers and competitive in the job market.
- Team Learning Logs: What teams have learned during projects, meetings, or regular work activities. Team learning logs help capture insights, foster continuous improvement, and encourage knowledge sharing within the organization.
Continuous Improvement
- Value Stream Flow Efficiency: The ratio of value-added time to the total time taken in a process. This metric helps assess how efficiently work moves through the value stream, identifying delays or waste that can be reduced to improve overall productivity.
- Reduction in Recurring Impediments: Measures the decrease in frequency or severity of obstacles that repeatedly disrupt the workflow or process. This metric indicates improvements in addressing root causes and creating a smoother process over time.
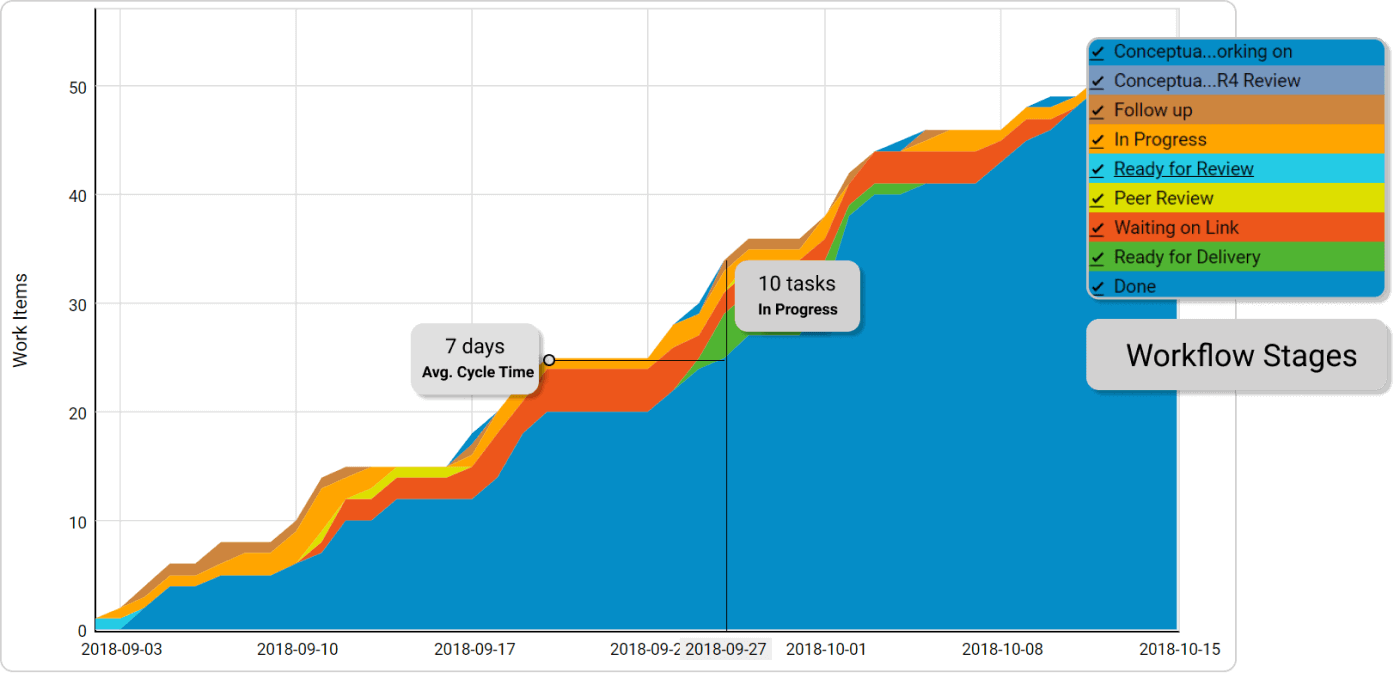
- Cumulative Flow: A visual chart showing the progress of work items across different workflow stages over time. It helps identify bottlenecks and track the overall flow of tasks, providing insights into the stability and predictability of the process.
Predictability
- % Complete of Sprint Plan: The percentage of planned work completed by a sprint's end. This metric assesses the team's ability to meet its commitments and helps with planning accuracy.
- Velocity Variability: The degree of fluctuation in the team's velocity (amount of work completed for a given period) over time. High variability can indicate inconsistencies in planning, estimation, or execution, while low variability suggests more predictable and stable performance.
- Say-Do Ratio: What a team commits to doing (say) versus what they actually complete (do). A higher Say-Do ratio indicates better alignment between planning and execution, reflecting reliable and realistic commitments.
- Unplanned Work Items: The number of tasks that were not part of the original plan but were added during the project. This metric indicates how much reactive work is being done and can highlight issues with planning or unforeseen challenges.
Bonus Track: Measuring Team Engagement as a Key to a Successful Agile Transformation
To complement these metrics, there is an area we must measure and not forget: the human component of the Agile transformation. After all, a company is made up of the people who comprise it and their relationships. Therefore, we recommend evaluating employee participation and engagement in the transformation.
A vital aspect of a successful Agile transformation is team engagement. Engagement can be measured through employee satisfaction surveys (eNPS), staff turnover rates, and participation in continuous improvement initiatives. Highly engaged teams tend to be more productive and deliver better results.

Victor Fairen
Founding Partner of SmartWay | Agile & Kanban Professor
Victor is the Founding Partner of SmartWay, an Agile & Kanban Professor, and a Lean-Agile Consultant with extensive experience as a Strategic Advisor and VP at SmartWay. He helps companies improve their products and processes and guides them on their journey to business agility. As a trainer, Victor shares his knowledge of Lean and Agile mindset, offering valuable insights and experiences.