“When will it be done?”
“How long is this going to take?”
These are common questions typically asked in a predictable environment where detailed plans of execution with defined deadlines are laid out at the beginning of every project. For a long time, this was the pattern for project planning and estimating when they will be completed.
But does it work in every case?
It is a whole other story in the dynamic world of knowledge work. As work becomes more flexible and uncertainties determine the course of action, project managers need a new way of predicting when a work item or a whole project will be done.
This new way relies on making probability-based forecasts using historical data rather than specific dates.
Forecasting vs. Estimating in Agile and Kanban
As you are probably familiar, the standard way of making predictions in Agile is by measuring the size of work items (in story points) and tracking velocity. However, this approach poses some problems with predictability.
A common phenomenon is when two or more work items estimated with the same number of story points have different completion times. This creates discrepancies in our capabilities and leads to spending valuable time re-estimating.
Furthermore, story points don't account for components such as high amounts of WIP, time spent in queues, and blockers. But those are all factors that influence when a project will be done.
That's why to create predictability, we should focus on project forecasting by using historical data. In Kanban, for example, we measure metrics such as lead time, cycle time, and throughput. Combining them gives you all you need to simulate different probabilities of project completion.
To accomplish this in practice, you need a system that collects and processes the data. This is where Businessmap can help.
Forecasting with Kanban (and Businessmap)
The main focus of Kanban is on flow management. The idea is to progressively evolve your work process by measuring workflow data and then using it to achieve more predictable service delivery.
With Businessmap, you can collect that historical data and then apply Monte Carlo simulations to derive a given certainty of when a project will be done or how much scope you can complete by a specific date.
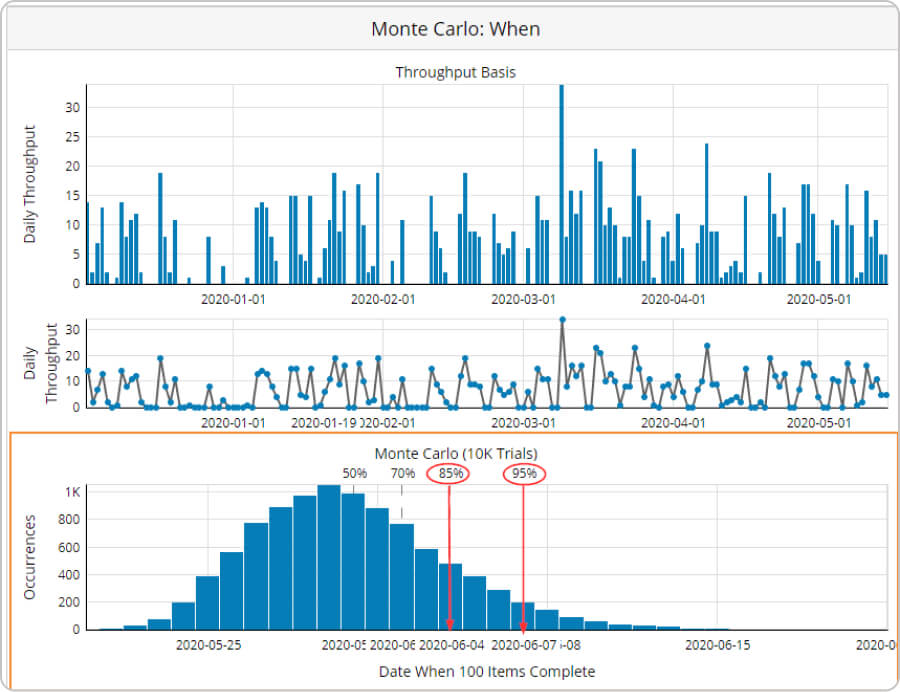 Forecasting probabilities of project delivery with Monte Carlo simulations
For example, instead of giving promises that "X" will be completed by the 4th of June, you can use your past performance to forecast that there is 85% certainty for "X" to be done by then. Using Monte Carlo simulation, you can segment your data according to your work process structure, providing a more precise probability of when a task might be completed.
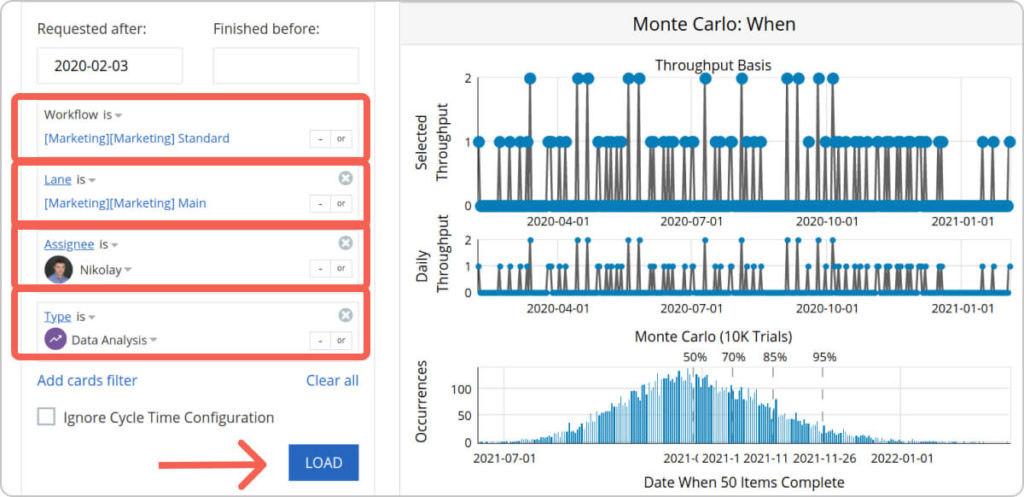 Using filters of workflow data to refine project forecasts with Monte Carlo simulations
However, before you can begin, you need to take a step back and consider a crucial prerequisite: the stability of your workflow.
Paving the Way for a Stable Workflow
In Kanban, project forecasting is tightly related to how stable and predictable your workflow is. In other words, you need to balance work arrivals with departures, monitor increasing WIP, and alleviate bottlenecks to maintain a smooth flow.
With the help of a digital solution like Businessmap, for instance, you can set WIP limits on your Kanban boards to direct your team's focus on completing tasks rather than initiating new ones. Additionally, Cumulative Flow Diagrams can help you monitor the progress of work through your process.
Cumulative flow diagram
The key is to notice if the bands are expanding. If they are, it means more work is entering the process than exiting, leading to lengthy queues or bottlenecks. This will increase your cycle time and adversely affect your system's predictability.
Visualizing queue columns and bottlenecks on a cumulative flow diagram
Regularly analyze your workflow and limit WIP to achieve a more stable and predictable process.
Historical Data as a Ground Base for Kanban Forecasting
Once the prerequisite is met, you can start making forecasts using the software platform. For every project you create, you will find a "Forecast" tab.
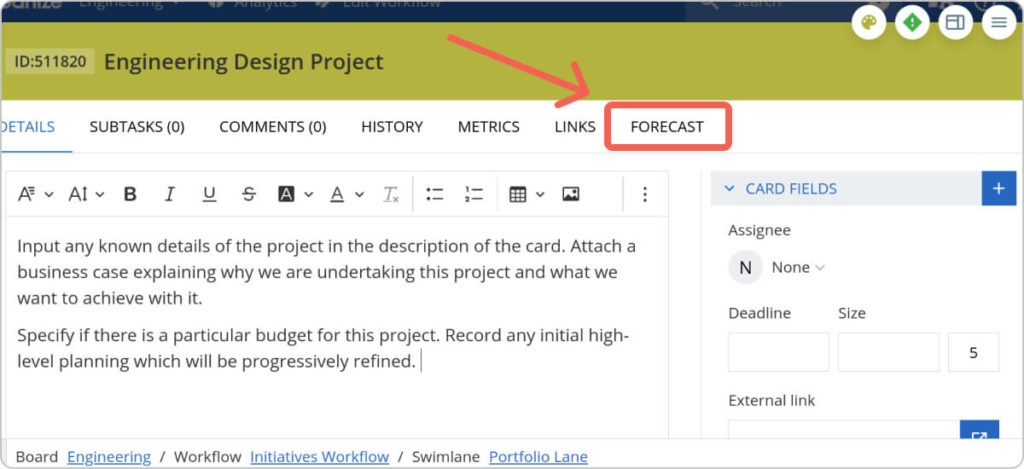 Forecast feature in Businessmap
For the sake of the example, suppose you are undertaking a project to improve your product's UX design. You've collaborated with your team to define the initial scope and broken it down into work items.
As we stated earlier, we use Monte Carlo simulations for project forecasting.
The "Forecast" tab integrates these simulations with the historical data of the work items. This allows the system to run simulations based on similar tasks completed in the past.
The system will then generate different outcomes for the project's completion: "optimistic," "realistic," "pessimistic," and "very pessimistic."
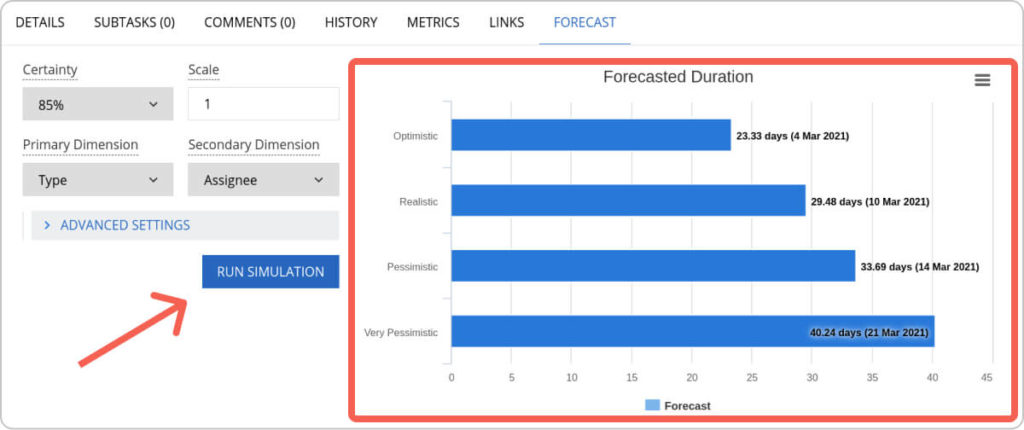 Visualization of project delivery outcomes using the Forecast feature
When visualizing project delivery outcomes using the Forecast feature, there are a few key points to consider.
First, decide the certainty level you want to commit to. For example, choosing the 85th percentile means there is an 85% chance the forecasted duration is accurate based on historical data. For higher certainty, select a higher percentile (e.g., 95%), which will result in longer durations.
Another important parameter is the "Scale" function, which helps assess the project's complexity and the parallelism of its work items.
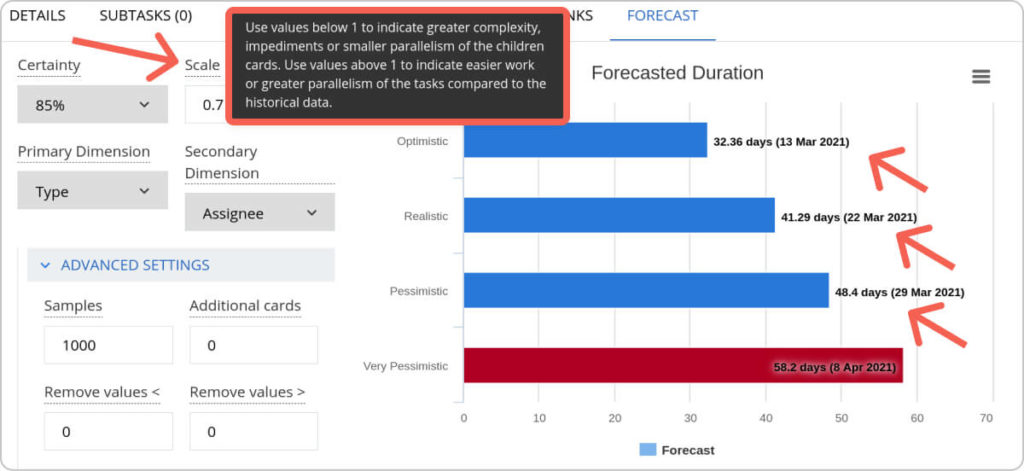 Visualization of the project delivery outcomes, including work items' complexity factors
For example, let's say that for the engineering design project, you've identified that roughly 30% of your tasks will need more research than usual. To reflect this in your plan, you can lower the "Scale" indicator from 1 to 0.7. As a result, you will be able to integrate that uncertainty within your original forecast and increase its duration by approximately 30%.
It's important to remember that all of this will not happen right off the bat because you need to gather historical data on your throughput and cycle times. Still, even a few completed projects will enable you to start planning in a way that reflects the uncertainty that befalls most knowledge work projects nowadays.
As a result, your forecasts will be based on actual historical data rather than on estimates of what might happen.
The Positive Impacts of Kanban Forecasting
Forecasting when a project will be completed comes with many benefits that your business can take great advantage of. Let's take a look at them:
- Answer the question "When will it be done": Project managers often grapple with this question. In a knowledge work environment, providing a clear answer is challenging due to frequently changing requirements. Consider a typical scenario where an important stakeholder asks for a timeline during a meeting. Instead of attempting to predict the future, project forecasting enables you to present "optimistic," "realistic," and "pessimistic" delivery estimates, each with a given probability. This approach allows you to account for uncertainty, build in buffers, and accurately reflect your team's actual capabilities.
-
Eliminate the need for repeated estimations: While estimating might be your only choice to plan when you don't have sufficient data yet, it shouldn't be your "go-to" solution. Estimating practices takes the time that could be spent on delivering actual value. With project forecasting, you need to focus on increasing the predictability of your process. Then, discuss the project's complexity and your team's available capacity. The forecasting algorithm will take care of the rest.
- Easily adapt your plans: In knowledge work projects, it's not uncommon for new scopes to emerge halfway through. With an automated system running thousands of simulations to forecast outcomes, manual estimation for new tasks becomes unnecessary. Simply incorporate the new work into the project, assess its impact on your "scale" factor, and initiate the simulation.
Take Small Steps and Continuously Improve
Project forecasting is a vast topic that I am only scratching the surface of. There are many factors that you need to consider before starting to make accurate forecasts.
Nonetheless, the concept holds significance. While you may provide estimates initially, it's crucial to take incremental steps every day toward enhancing the predictability of your process. This ongoing improvement will enable you to refine your forecasts continuously, ultimately leading to the development of genuinely agile project plans.
Businessmap is the most flexible software, helping your company gain visibility across all projects/portfolios, align on goals, and deliver quality work faster.

Nikolay Tsonev
Product Marketing | PMI Agile | SAFe Agilist certified
Nick is a seasoned product marketer and subject matter expert at Businessmap, specializing in OKRs, strategy execution, and Lean management. Passionate about continuous improvement, he has authored numerous resources on modern-day management. As a certified PMI practitioner and SAFe Agilist, Nick frequently shares his insights at Lean/Agile conferences and management forums.