Let's get one thing straight from the start: there's no estimation in Kanban. Today, we share our perspective and experience on why estimation is not sufficient in today's volatile world of project management and how we handle it in Kanban.
Estimating vs. Forecasting
Estimation is a subjective process for finding estimates such as "what would be the duration of a project?" As project managers, it is in your power to arrive at those estimations. However, no matter your seniority and exposure in the field, estimations are still a well (or not so well) informed judgment and, therefore, prone to errors.
Estimation: a judgement or opinion about the value or quality of somebody/something
Source: www.oxfordlearnersdictionaries.com
To a certain degree, estimating depends on your perception and the way you derive them. Estimations are usually based on a gut feeling or experience. As such, they can be suitable for stable processes where you don't expect many changes along the way, and the final result is clearly defined. In knowledge work projects, however, changes are constantly arising due to the highly volatile business environment. Hence, you need a way to respond.
This is where probabilistic forecasting helps. There's no need to judge how many work items you can deliver at all. The historical performance of your team is the sole basis of the exact answer you're looking for - no educated guesses, no opinions.
Probabilistic vs. Deterministic Thinking
To understand the real abyss between estimation and forecasting, let's take weather forecast as an example. It requires and relies heavily on the probabilistic approach to arrive at certain outcomes. The reason - there's high variability in a weather forecast and exact estimations can pose a significant risk of failure to comply with our preliminary estimations.
Traditional project managers, for instance, aim to arrive at precise deadlines and delivery dates which makes their estimations prone to miscalculations. On the other hand, adopting a probabilistic approach to project delivery embraces variations and turns out highly effective in capturing deviations.
When talking about probabilistic and deterministic thinking, randomness comes to mind as a critical differentiator between the two. Rejecting all variability when making a project plan and relying on exact estimates puts deterministic thinking in a rough position when some changes arise along the way. Whereas, probabilistic thinking embraces a kind of healthy randomness in terms of variability.
How to Embrace Forecasting with Kanban?
Kanban provides a powerful alternative to estimates, through historical data and a wide range of insightful metrics. The method denounces the deterministic approach to estimating and enables a more humane model of probabilistic planning. This is done by creating more predictable processes, analyzing past delivery rates, and deriving possible outcomes that reflect the work variability. Thus, making project management and workflow more resilient to the vibrant business world.
Let's see how it does that in practice.
1. Using Kanban Visualization and WIP Limits to Uncover Bottlenecks and Create Predictable Workflows.
A couple of the foundational Kanban practices - visualization and introducing work-in-progress (WIP) limits, will not only allow you to gain transparency over your team's work and prevent your team from multitasking. By displaying all project tasks in a single place and visualizing workflow policies such as WIP limitations, you can quickly uncover impediments in your work process (bottlenecks). The information is a signal to perform a thorough work process analysis and introduce improvements where necessary.
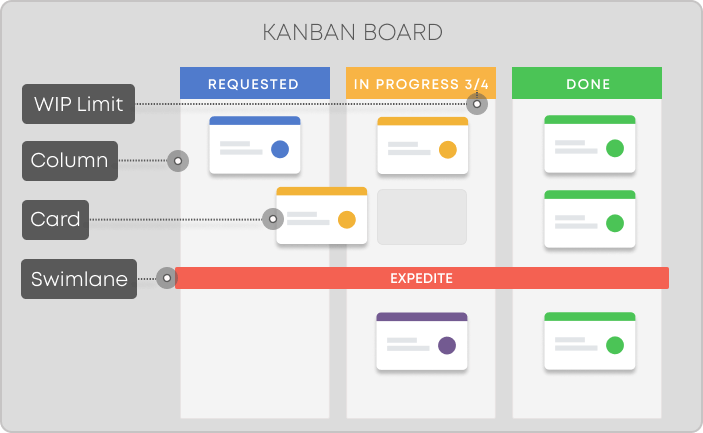
Kanban board elements
To easily identify the bottleneck in your work process, you can use one of the key metrics in Kanban - cycle time. For instance, by measuring how much time work items spend in each phase of a project, project managers can easily spot the culprit and take action to improve.
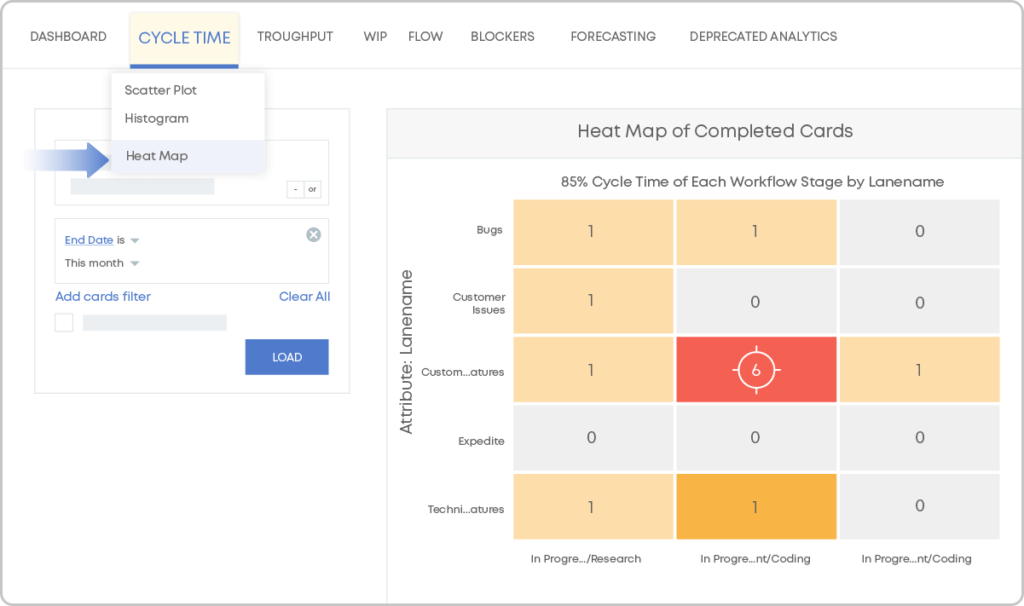
Cycle Time Heatmap
2. Inspect Cycle Time and Trends to Adjust Project Delivery Forecasts.
Cycle time - one of the most important metrics in Agile and Lean management, is key to understanding your team's performance over time. Knowing exactly how long it takes for given work items to get done (cycle time) empowers project managers to forecast the cycle time of future work. The probabilities allowed in the Cycle Time Scatterplot offer even greater leverage to project management professionals. The true gem of the Kanban scatterplot is the trend line. Having clarity into the changing trends in your team's performance is ideal for making more accurate forecasts of individual work items as well as entire projects.
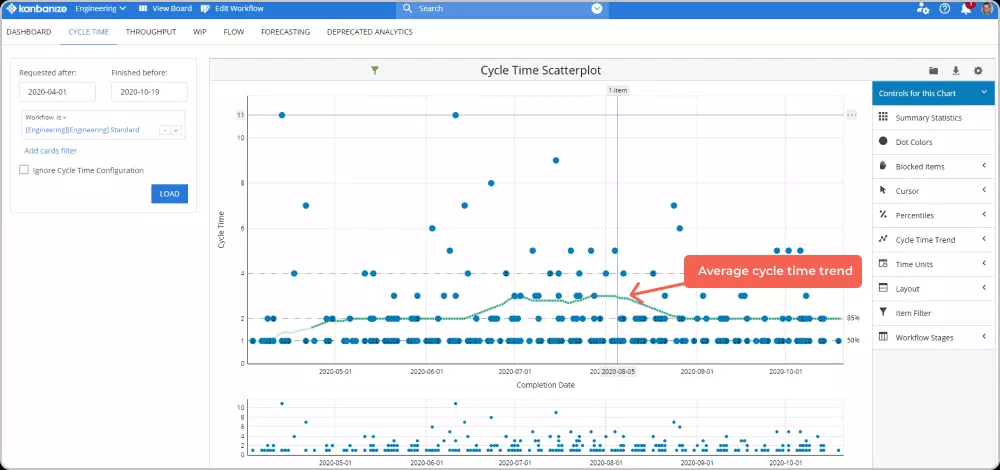
Cycle Time Scatter Plot trend line
3. Employing Monte Carlo Simulations to Foster Project Management Forecasts.
The true advantage of Monte Carlo analysis for projects and initiatives is that it provides project managers with realistic data-based forecasts. Having multiple views into the probability of certain outcomes makes project managers more adaptable to changes, hence, realistic forecasts outrun the need for precision by far. The only prerequisite to successful forecasting using Monte Carlo simulations is to have as much as possible accumulated data. The more historical data, the more accurate would be the forecasts.
With Monte Carlo analysis on a Kanban board, you can use simulations to understand how many work items your team can complete for a given period or to narrow down when a certain number of work items can be finished. To top these insights, the Monte Carlo analytics offer multiple probabilistic scenarios - ideal for your project forecasting.
Let's have a short overview of the 2 Monte Carlo simulation types.
The Monte Carlo: How Many chart aims to show you the minimum amount of tasks you can get done within the next "x" days. For example, you can use it if you've got a product update scheduled for the beginning of the next month and you wish to know how many tasks you can finish by then.
The simulation will take the historical throughput data of your workflow and assume that your team can finish:
- the "X" number of work items in the next 30 days with 95% certainty.
- the "Y" number of work items in the next 30 days with 85% certainty.
- the "Z" number of work items in the next 30 days with 75% certainty.
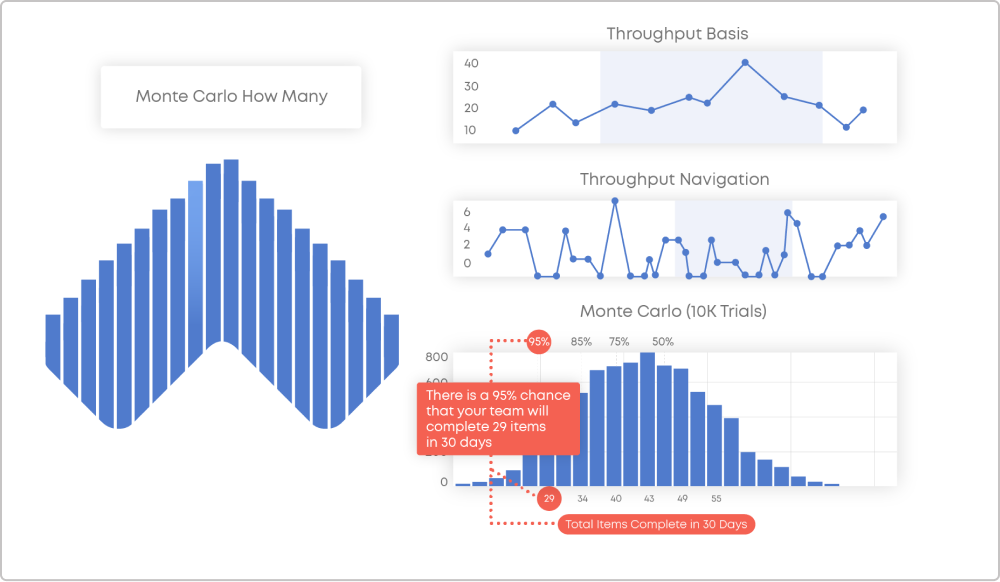
Monte Carlo: How Many
The Monte Carlo: When chart is almost the same, but the "When" simulation can estimate how long it is going to take you to complete a certain number of items (for example 100) in the future.
In this case, the simulation will give you forecasts as for example:
- the "X" number of work items can be completed by 10.02.2021 with 95% certainty.
- the "Y" number of work items can be completed by 2.02.2021 with 85% certainty.
- the "Z" number of work items can be completed by 25.01.2021 with 75% certainty.
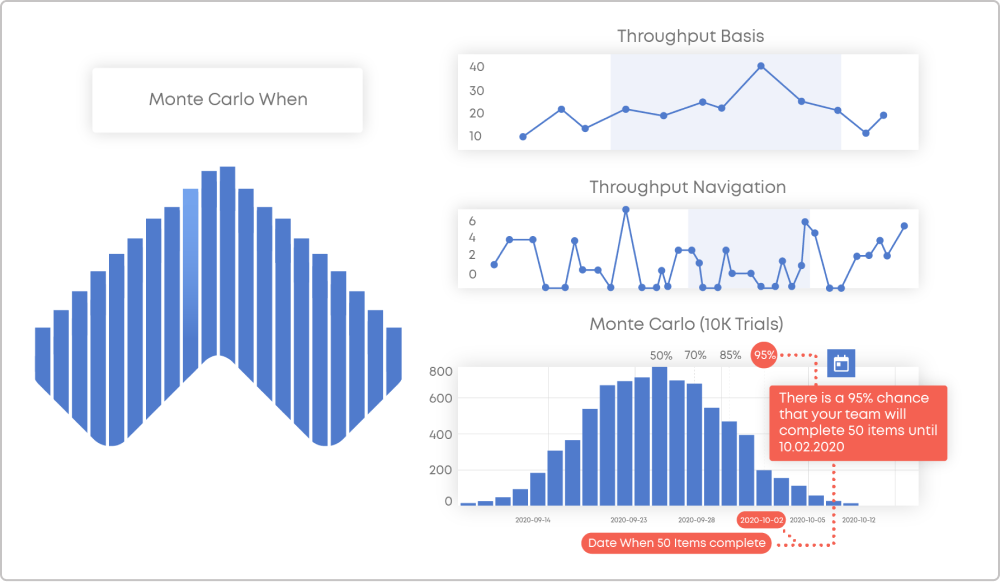
Monte Carlo: When
How to Use Probabilistic Forecasting in Kanbanize?
The ground prerequisite to effective forecasting is having a predictable work process. A predictable work process is a well-known, thoroughly inspected, and constantly analyzed process. We are learning every day from our experience, and we apply this knowledge to optimize our workflow.
Forecast Initiatives Using Project Forecasting Scenarios
Understanding the possible outcomes for the duration of initiatives and projects allows project managers to make data-driven forecasts. The different scenarios for the completion of given projects (from optimistic to very pessimistic) offer a range of probabilities to support your forecasts. Having a variety of forecasts based on real data reduces the possibility of making false assumptions based on "experience in the field" or another subjective argument.
For example, we integrate the Monte Carlo capabilities within our work items. By identifying project tasks similar to work done in the past, considering the delivery rate back then, and the project's complexity, we arrive at probabilistic forecasts about the current project delivery. These forecasts are entirely based on real data and provide a range of certainty percentiles.
A good practice we apply is monitoring the cycle time of our workflow, not allowing a lot of fluctuations, and applying work-in-progress (WIP) limits to prevent us from starting new work before finishing what's already been started.
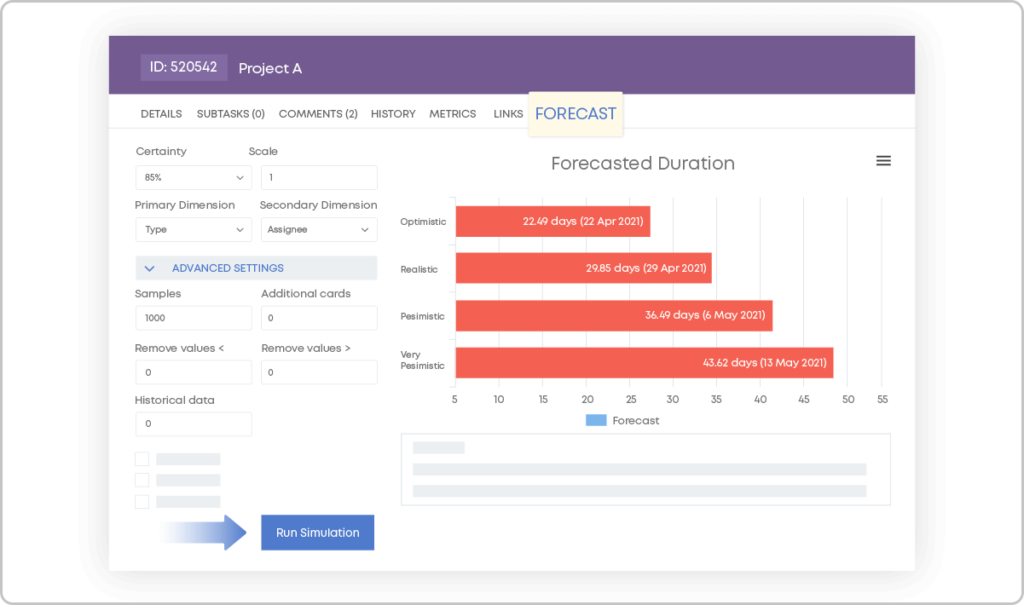
Project Forecasting feature in Kanbanize by Businessmap
What Are the Benefits of Probabilistic Project Forecasting?
- Provides insights into the real capacity of teams. Thanks to probabilistic forecasts, project managers can better understand and improve capacity allocation based on historical data.
- Allows more accurate project delivery projections based on real data. Monitoring cycle time fluctuations, applying workflow policies such as work-in-progress limits or service level expectations, and using simulations to generate possible outcomes help project managers make more informed forecasts about project delivery.
- Provides greater transparency to senior management. Using real data to make projections and the ability to show that data via comprehensive tools and graphs bring transparency and alignment with senior-level management.
For all of the above probabilistic forecasts to work, there's one thing you need to do and that's the desire to improve continuously. While accumulating more and more historical data, analyzing it, and taking improvement steps along the way, you will end up with a stable and predictable process. Trust us, we are doing it!

Iva Krasteva
Content Strategist | Agile Practitioner | Kanban Certified
Iva is a Kanban-certified Agile expert with hands-on experience in SEO, content creation, and Lean practices. She has published dozens of articles on Lean, Agile, and Kanban practical applications. Iva actively promotes collaborative, flexible work environments and regularly shares process optimization insights through writing.


