Work estimation has always been a problem in project management. To be more specific, the real pain is making a precise and realistic forecast of when you will finish the project and deliver value to your stakeholders.
In trying to solve this problem, managers have turned their gaze towards statistics to make data-driven forecasts. Very few tools can give you more certainty when anticipating future outcomes than the Monte Carlo simulation.
In Lean management, where continuous improvement is the driving philosophy, making realistic forecasts can be a daunting task. In order to challenge your team and yet commit to a reasonable deadline, you need to rely on data as much as experience.
What Is a Monte Carlo Simulation?
The Monte Carlo simulation is a mathematical technique that helps you account for risk and make data-driven decisions. It is based on historical data and runs multiple simulations to project the likely outcomes of future projects under similar circumstances.
Since the simulation was introduced in the middle of the 20th century, it has proven to be a highly realistic way to present the probability of future events without guessing.
Logically, the Monte Carlo simulations have reached Lean and Agile project management. They are a "must-have" feature in professional software solutions for Lean or Agile adoption. With their help, you can make probabilistic forecasts for one of the most important performance indicators in project management: throughput.
Businessmap is the most flexible software
to align work with company goals
What Is the Role of Monte Carlo Analysis in Project Management?
The primary purpose of the Monte Carlo Analysis is to predict the future outcome of a project by running many simulations or scenarios. It is like rolling the dice repeatedly to see all the possible outcomes.
Data shows that poorly defined risks and inaccurate time estimation are among the most common reasons projects fail (29% and 25%, respectively). These alarming stats call for better project forecasting. By incorporating Monte Carlo simulations, project managers can make more accurate forecasts, which leads to more effective and resilient project planning and execution.
As an example, imagine you want to estimate how long a project will take to complete. Instead of giving one fixed answer, a Monte Carlo simulation uses random inputs within defined limits to simulate a large number of possible outcomes. This provides a range of possible results and the probabilities of different outcomes happening.
This technique offers several benefits to project managers, including a better understanding of project risks and uncertainties, more informed decisions, and improved planning as they set realistic expectations.
Monte Carlo Analysis and Forecasting in Action
The Monte Carlo analysis can answer two of the most important questions in project management:
-
How many tasks can we finish in a certain period?
-
When can we complete X number of work items?
Using the two main Monte Carlo charts, How Many and When, project managers and decision-makers can run many trials to provide more precise predictions based on historical data collected, leading to more effective and resilient project planning and execution.
Without further ado, let's explore how these two forecasting analytics work in action.
How Many Tasks Can We Finish in X Number of Days?
When using the Monte Carlo analysis to forecast how many work items your team can finish in an X number of days, you need to select a past time frame and get the throughput data for the period.
The simulation will use a statistical equation that takes the throughput of a random day in the predefined past time frame and simulate several options of how many work items the team is likely to get done on a random day in the future.
For example, you can take the throughput data of your team's Kanban board for the last month (e.g., April) and make a probabilistic forecast on how many tasks they will be able to finish in May. Let's say that on April 2nd, your team had a throughput of 20 tasks.
The simulation will take this data and assume that this is how many assignments they will finish on May 15th. To project the probable throughput of May 29th, the Monte Carlo Simulation will take the throughput of another random day in April.
This process needs to be repeated at least a thousand times to get a statistically believable prognosis. To make it more believable, most of the tools allow you to run the simulation up to 100K times.
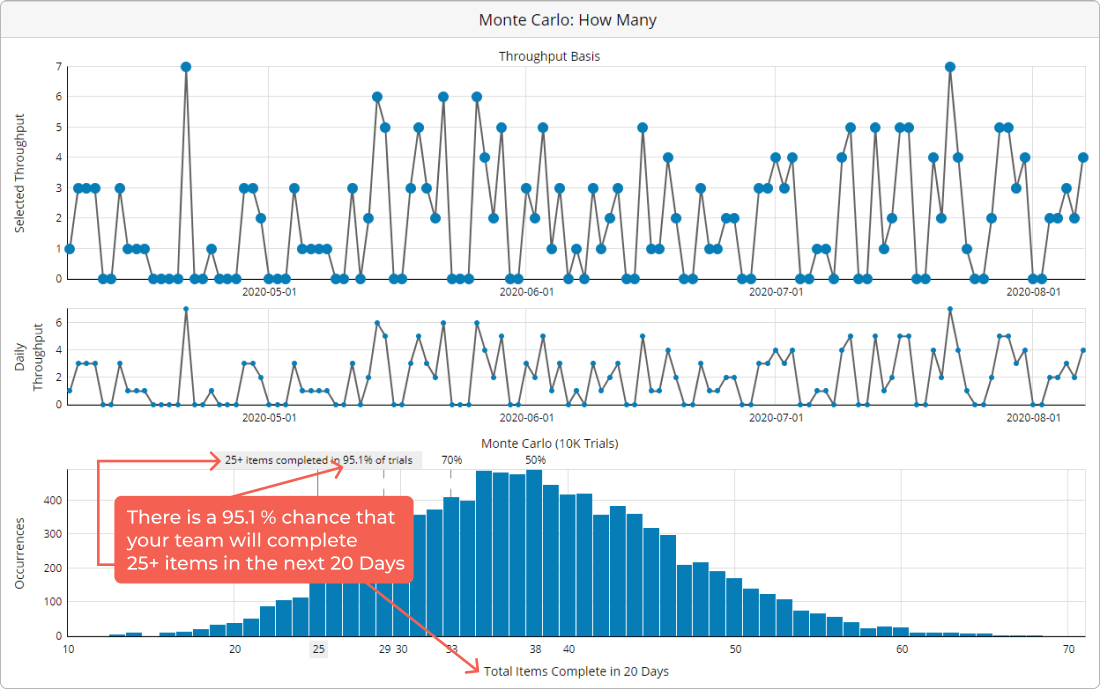
 Example of Monte Carlo: How Many
The most convenient way to visualize the results of a Monte Carlo simulation for Lean or Agile management is in the form of a histogram.
Similarly to the cycle time scatter plot, the prognosis comes in the form of percentiles. The chart will show you the simulation results and how likely you are to achieve a certain throughput level. Logically, with a greater number of finished tasks, the percentile of certainty will be dropping.
For example, if the results range from 35 to 135 tasks, you will have more than 99 percent certainty that your team will complete 35 tasks and less than 1 percent chance for them to complete 135 assignments.
When Can We Finish X Number of Tasks?
Forecasting when you can expect a specific number of tasks to be completed is of no lesser importance in Lean and Agile project management. As mentioned earlier, the simulation can be run to show you precisely this kind of data.
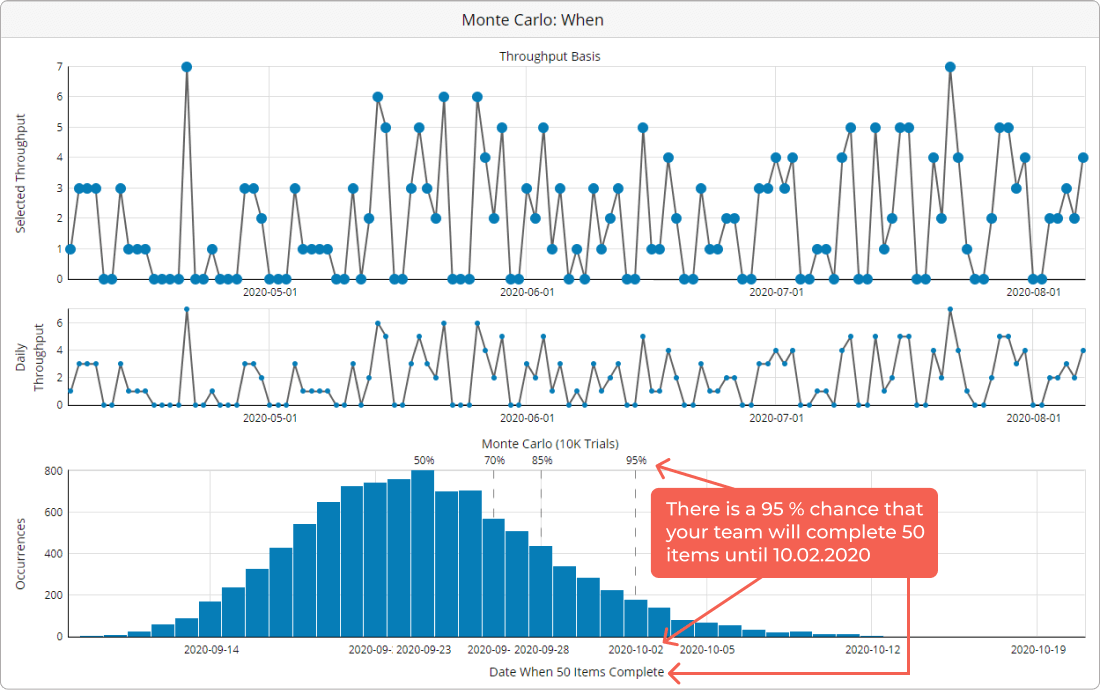
The mechanism is the same, but instead of showing you how many work items you are to expect by a date of your choice, here the simulation tells you how fast you are likely to finish a specific number of tasks on your Kanban board.
 Example of Monte Carlo: When
This can be especially useful when you are running a portfolio Kanban, have already broken down your work into a precise number of tasks, and wish to know when you can realistically expect your team to be done with them.
At the end of the day, when you break down any given project into an exact number of small tasks, you will be able to forecast when a project can be completed and with what certainty. Monte Carlo simulations can be the light that you need to stop shooting blindly when committing to deadlines. Although they are complex and difficult to understand initially, adopting Monte Carlo simulations can be a key to achieving continuous improvement.
Businessmap is the most flexible software
to align work with company goals
In Summary
The Monte Carlo simulation is a powerful analytics tool for Lean project management that extracts historical data from your workflow and helps you:
- Predict future outcomes of your throughput and cycle time
- Forecast the quantity of work that can be completed in a predefined period of time
- Organize your team’s capacity for future periods of time based on precise predictions


 Example of Monte Carlo: How Many
  Example of Monte Carlo: When


