First, What Is Project Forecasting?
Imagine you're setting off on a cross-country road trip. You wouldn't just hop in your car and start driving aimlessly, right? You would probably plan your route, estimate how long each journey stage might take, consider potential roadblocks, and ensure you have enough fuel and snacks to keep going.
Project forecasting in project management is much like this—it's about mapping out the journey of your project from start to finish, anticipating the bumps along the way, and planning accordingly to ensure a smooth ride.
At its core, project forecasting is the art and science of predicting a project's future performance. It involves using historical data, current project status, and predictive analytics to estimate timelines, budgets, resource needs, and potential risks.
I would like to stress something here: HISTORICAL DATA. Traditionally, answering the question "When will it be done?" happens in a deterministic way, where teams prepare strict deadlines for their projects.
While this approach works for stable projects, operating in a volatile environment requires a way to reflect our plans' uncertainty. This calls for probabilistic planning, where project managers communicate possible outcomes (forecasts) instead of specific dates (estimates).
Key Components of Project Forecasting
In theory, there are six essential components when it comes to project forecasting:
- Duration
- Cost
- Scope
- Quality
- Risk
- Resources
In reality, project forecasting turns into number crunching and spreadsheets. It's like assembling a jigsaw puzzle where each piece is vital to seeing the full picture of your project's future.
And it is still a wild ride of uncertainty, especially when human error is thrown into the mix.
But who needs this?
The Inevitable Uncertainty of Project Forecasting
Let's start with a hard truth: most project managers don't do true forecasting—they do estimating. And there's a world of difference between the two. Estimating is like saying, "We'll probably reach our destination in about six hours."
Forecasting, on the other hand, involves sophisticated modeling, real-time data, and predictive analytics.
So, what is the answer?
Just to clarify, in the next sections, we are not going to dig deeper into the six essential components I mentioned above. Instead, I will try to give a fresh new view on project forecasting.
Let’s get going.
5 Ways to Improve Your Project Forecasting
1. Map Your Value Streams
Are you surprised? Let me explain. Everything starts with a stable and predictable system. Yes, there are always external factors and turbulences, but if you want relatively good project forecasting, you need to visualize your work. By doing so, you gain a clearer understanding of the workflows, enabling you to anticipate challenges and adapt proactively.
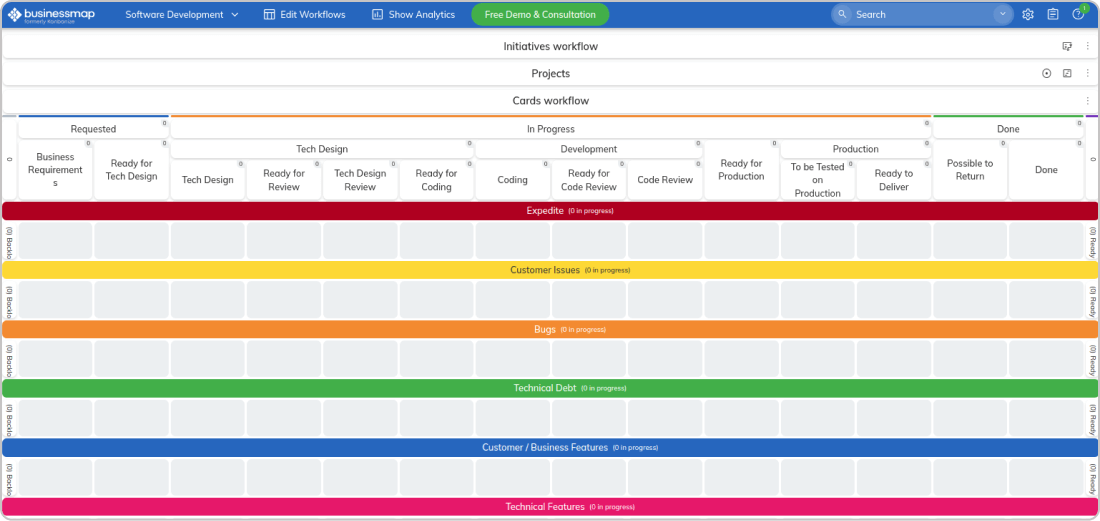
It is easy. For example, with Businessmap you can effortlessly map your workflows and see where and how work happens, where bottlenecks occur, and where you can improve.
2. Lay the Foundations of a Stable Workflow
To a great extend accurate project forecasting depends on the stability and predictability of your workflow. To ensure a smooth process, it's essential to balance incoming tasks with completed ones, keep an eye on increasing Work In Progress, and address bottlenecks promptly.
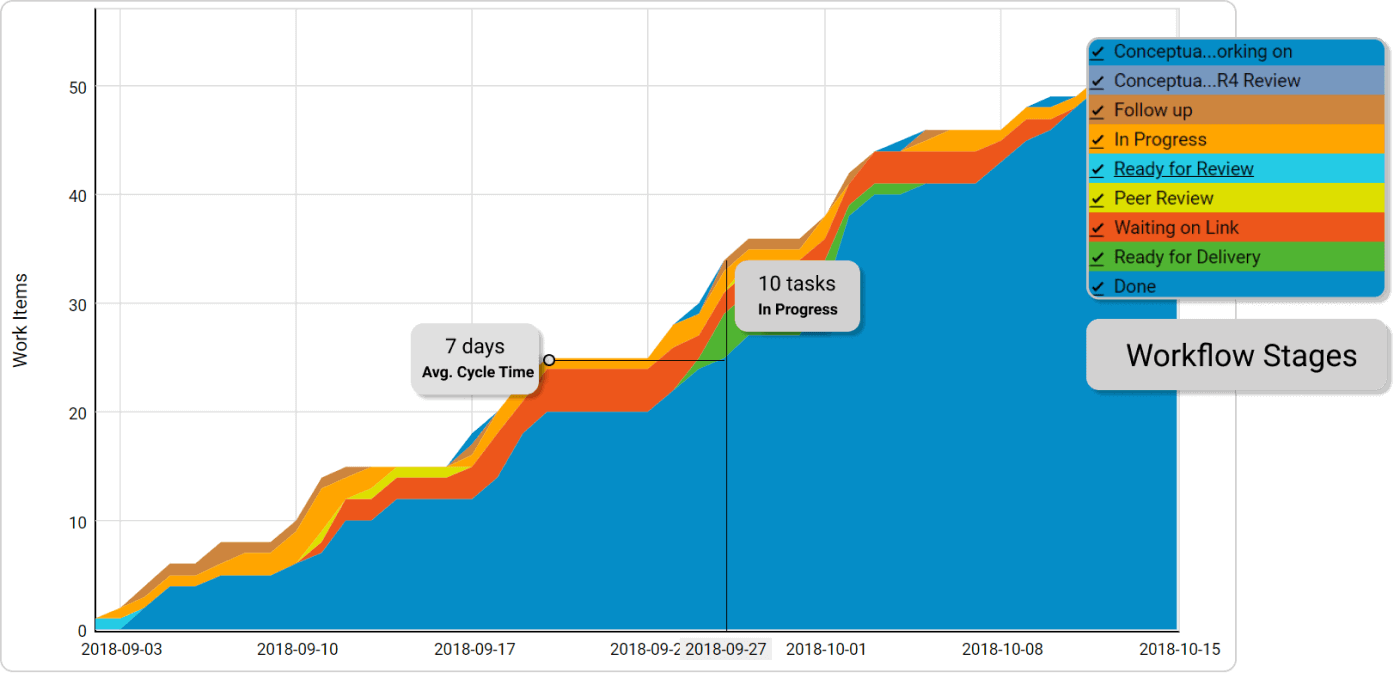
With Businessmap, for example, you can place work in progress (WIP) limits on your boards and focus your team's attention on finishing rather than starting new work. Furthermore, Cumulative flow diagrams can help you track how work flows through your process.
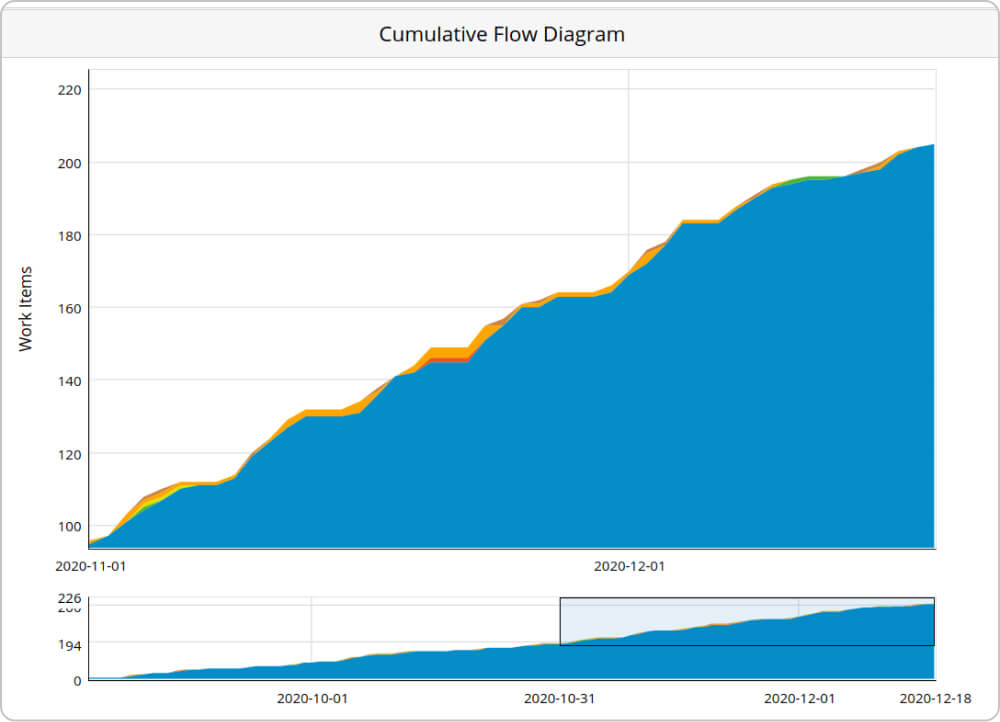
The important thing here is to spot if bands are expanding. If that's the case, more work arrives than departures your process, which is likely to accumulate lengthy queues (bottlenecks). This will increase your cycle time and negatively impact your system's predictability.
Ensure that you analyze your workflow regularly and limit WIP, so you can soon start to see a more stable and predictable workflow.
3. Collect, Analyze, and Use Data Properly
Of course, it's crucial to have a robust system for collecting and efficiently utilizing workflow data. With Businessmap, you can gather historical data and apply Monte Carlo simulations to predict project completion dates or estimate how much scope you can achieve by a certain deadline.
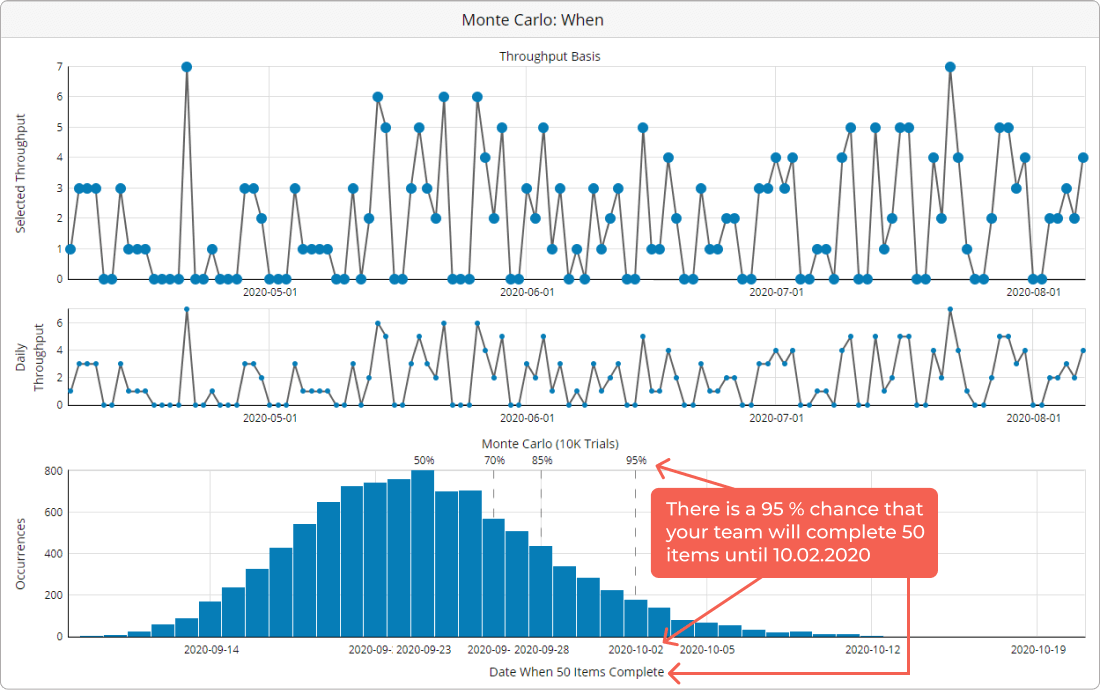 Forecasting probabilities of project delivery with Monte Carlo simulations
For example, instead of giving promises that "X" will be completed by the 10th of February, you can use your past performance to forecast that there is 95% certainty for "X" to be done by then. Through the Monte Carlo simulation, you can also segment your data based on your work process structure. This will give you a more refined probability of when something could be completed.
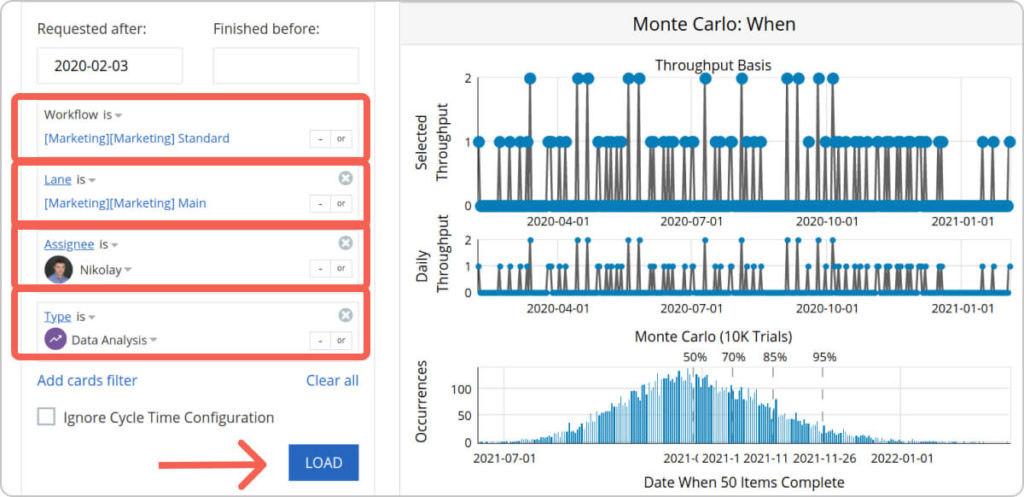 Using filters of workflow data to refine project forecasts with Monte Carlo simulations
However, before you can start doing all of that, you must first stabilize your workflow.
4. Forecasting Projects with Historical Data
Once we have the above prerequisite, it's time to start making our forecasts using the software platform. For every project you create in the system, you will notice a special tab called "Forecast".
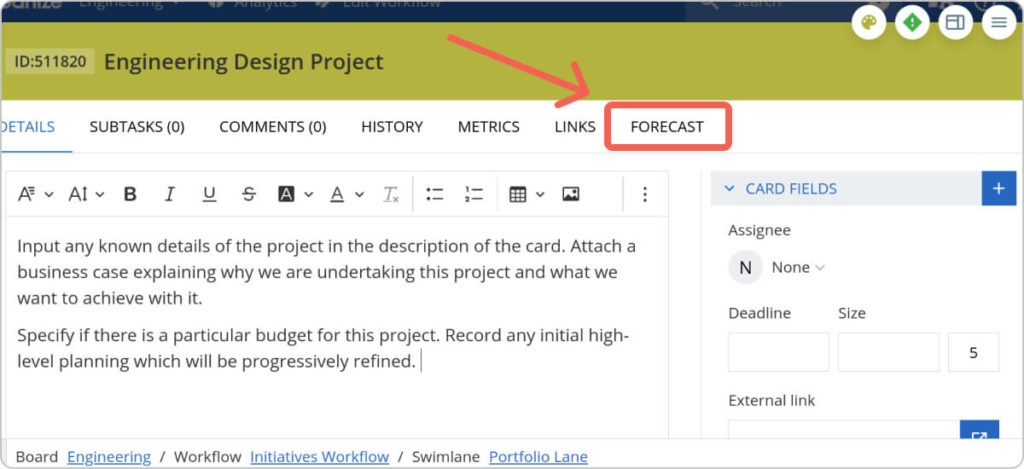 Forecast feature
For the sake of the example, let's say that you are undertaking a project to improve your product's UX design. You've collaborated with your team to prepare the initial scope, and you've broken it down into some work items.
As we mentioned above, we use Monte Carlo simulations for project forecasting.
That's why the "Forecast" tab includes integration between them and the historical data of the broken-down work items. This is done to run simulations based on similar tasks (to the ones in your current project), which you've completed in the past.
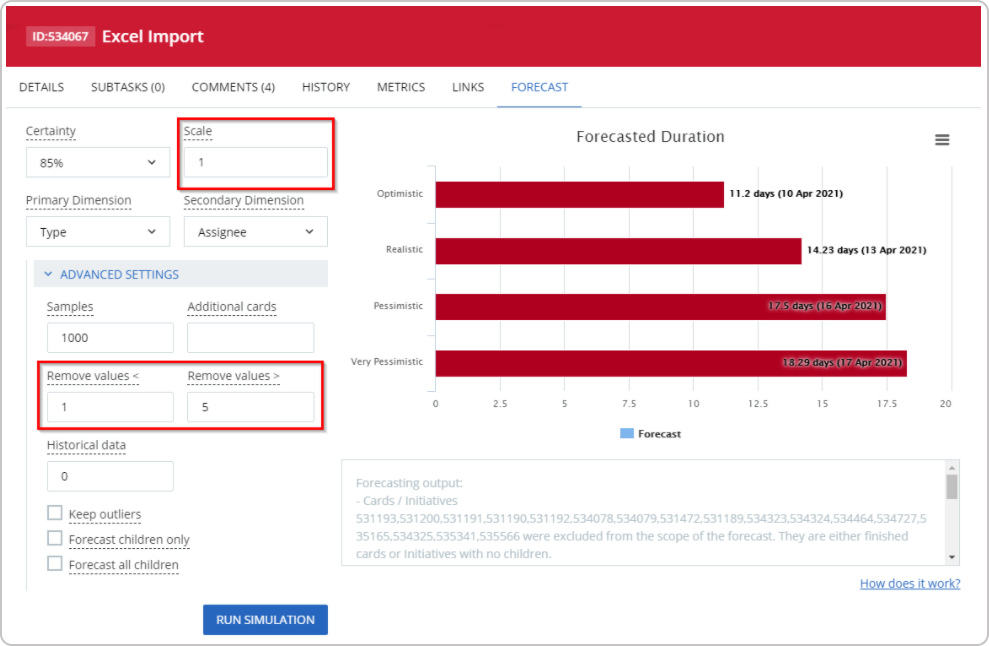
As a result, the system will populate different outcomes for the project’s completion: "optimistic", "realistic", "pessimistic", and "very pessimistic".
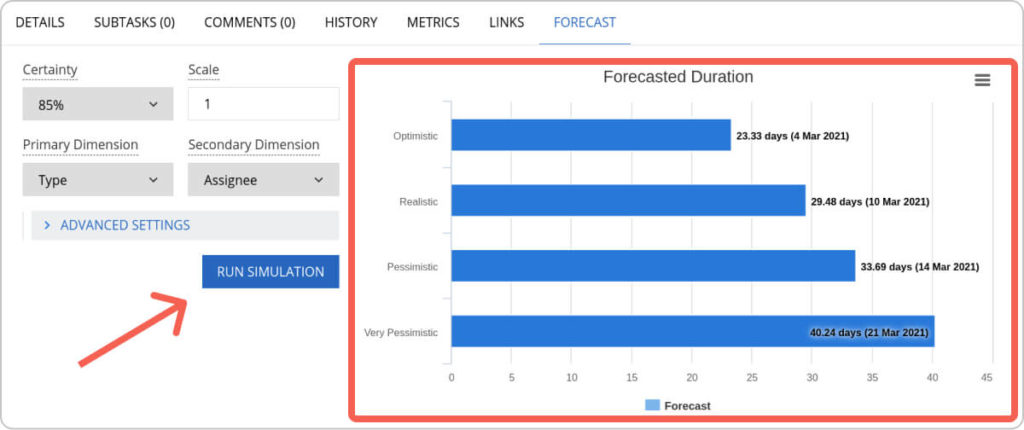 Visualization of project delivery outcomes using the Forecast feature
There are a few important things to mention here.
First of all, you should decide what certainty you want to commit to. As you can see from above, I've chosen the 85th percentile, which means that (based on my historical data) there is an 85% chance of the forecasted duration being correct. If you want to increase the forecast's certainty, though, you can select a higher percentile (ex. 95%) which will result in longer durations.
Another important parameter is the "Scale" function. This helps you assess the complexity of the project and the parallelism of its work items. 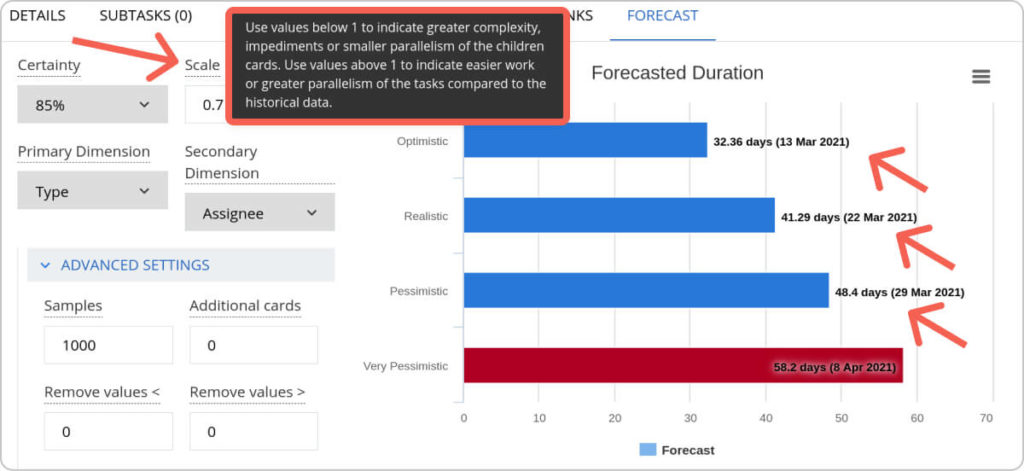 Visualization of the project delivery outcomes, including work items' complexity factors
Let's illustrate this with an engineering design project. You anticipate that 30% of the tasks might require more research than initially planned. To account for this uncertainty, consider adjusting your "Scale" factor in your project plan. Lowering it from 1 (original estimate) to 0.7 (adjusted estimate) reflects the additional research needed. This translates to roughly a 30% increase in project duration, effectively integrating the uncertainty into your initial forecast.
While historical data on project completion times and throughput would be helpful, it's not essential to start planning for uncertainty. Even with just a few completed projects under your belt, you can begin incorporating flexibility into your plans to accommodate the inevitable unknowns that knowledge work often entails.
As a result, you will create forecasts based on what really happened and not what you thought might happen (estimation).
5. Get to Know Your Resources and When a New Project Can Be Started
Before I dive deep into this section, let me clarify something. By resources, I mean human resources—people.
So, in case you need a specific group of people to open a new project, here is what you can do.
Let's start by understanding your team's current workload. This will help us determine how many work items are assigned to specific team members and, therefore, must be finished before they can take on something new.
To determine how many work items are assigned to specific team members and need completion before they can take on new tasks, you can leverage Businessmap's search function. Here's what you'll need to include in your search criteria:
- Assignee: Specify the team member(s) whose workload you want to assess.
- Section: Filter by sections like "Requested" or "In Progress" to focus on unfinished work items. You can also add "Backlog" if you want to include those tasks.
By running this search, you'll retrieve the total number of unfinished work items assigned to those individuals, providing a clearer picture of their current workload capacity.
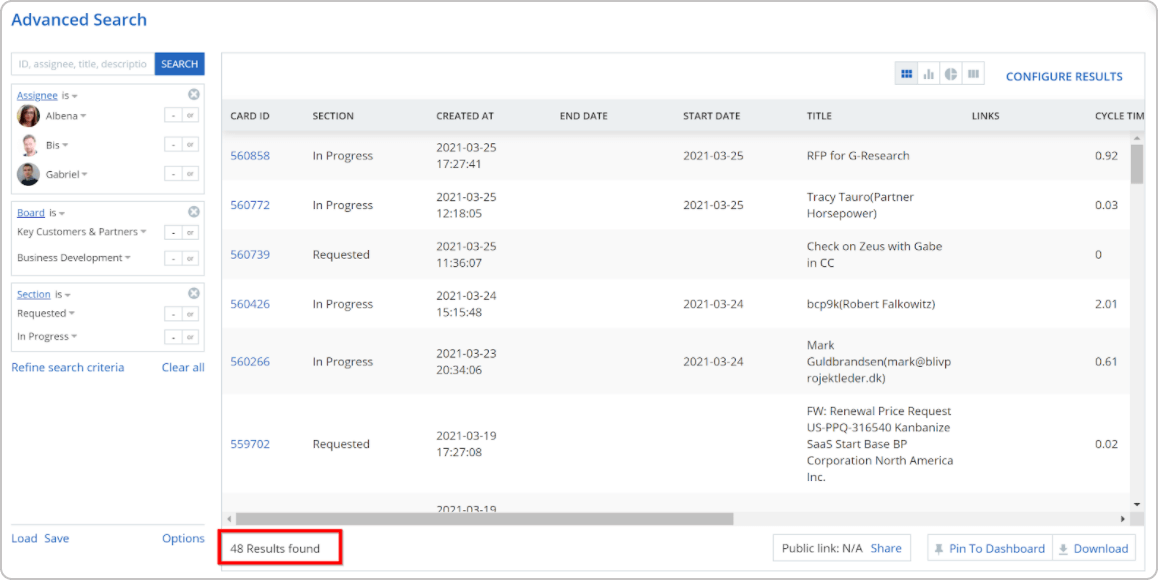
With this data, you can leverage the Monte Carlo simulation widgets in Businessmap to determine when these 48 work items may be finished. This powerful tool allows you to factor in uncertainties like task durations and dependencies, providing a more realistic estimate of project completion time.
First, add the Monte Carlo When widget to your dashboard and configure the settings to be like this:
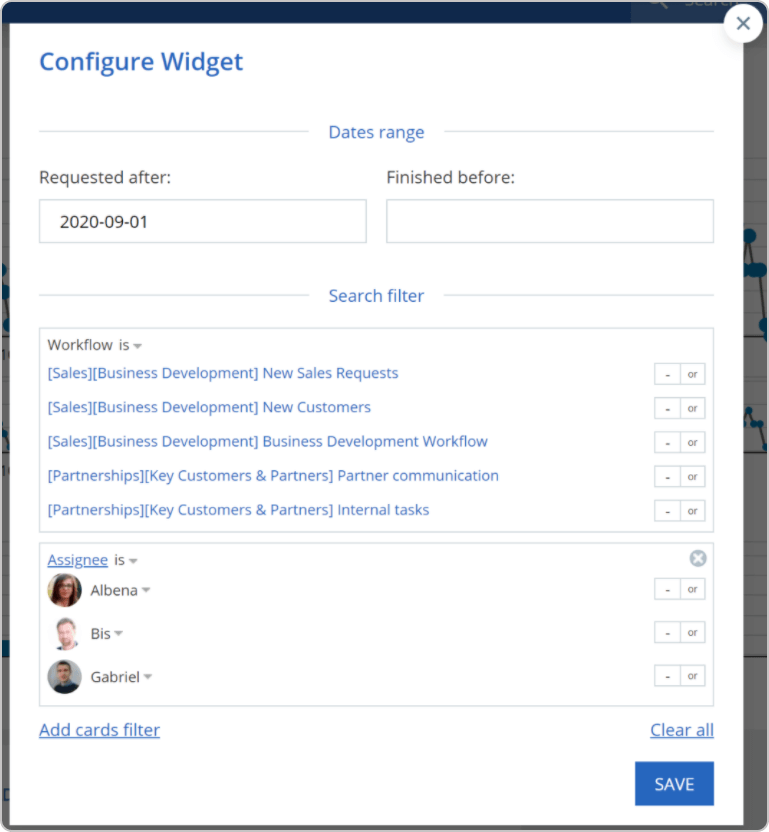
Once you have the number of unfinished work items from the Businessmap search (e.g., 48), you can utilize the Monte Carlo simulation widget. However, ensure the widget settings mirror your previous search criteria.
Here's a crucial point: set the "Requested after" date sufficiently far back in time. This allows the system to gather enough historical data for an accurate simulation. If the widget displays no data or the results seem unreasonable, try increasing the time interval for "Requested after".
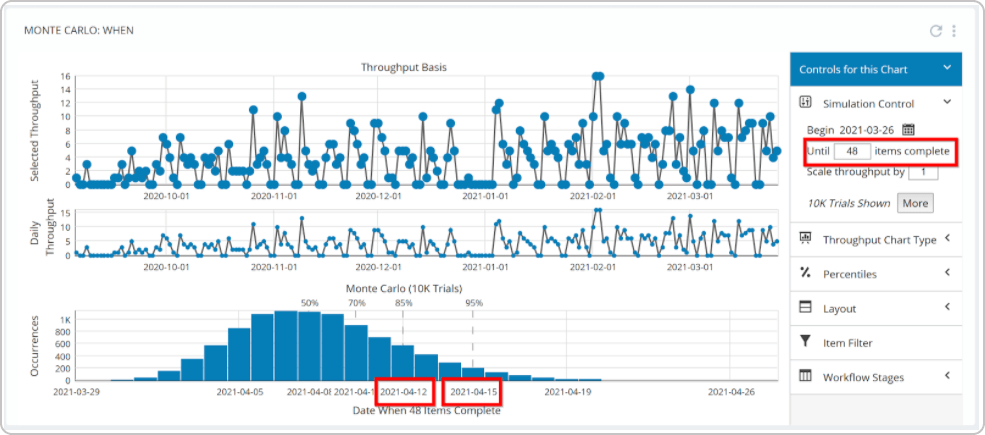
After you enter the number of work items, the Monte Carlo simulation will present a range of possible completion dates for those 48 cards. Each projected date will have an associated probability (like 50%, 70%, or 95%), indicating the likelihood of completion by that specific date.
Alternatively, you can use the project forecast feature that I mentioned in the previous section. But this time, let’s say you want to plan future projects based on your team's capacity.
Creating a project plan seems straightforward if you have historical data—you create work items and link them to a project initiative, and voila, Businessmap generates a forecast.
Let's be honest, initial forecasts often require adjustments. Real-world projects rarely unfold exactly as planned. To bridge this gap, Businessmap offers the "Scale" parameter. This powerful tool allows you to incorporate key assumptions about the work's nature, such as complexity and how many people can work on tasks simultaneously (parallelism).
By adjusting the "Scale" parameter, you can refine your forecast to better reflect potential challenges and create a more realistic timeline.
Don't feel pressured to create a complete project breakdown upfront. Businessmap offers the "Additional cards" parameter for a simpler approach to forecasting.
This parameter is particularly useful in the following scenarios:
- Accounting for future scope additions: If you anticipate additional work items being added to the project later, you can use "Additional cards" to factor that in. Simply estimate the number of extra cards (X) and enter that value in the parameter.
- For example: Let's say you have a representative sample of the project's work items (e.g., 10% of the total 2000). You can create cards for this sample while maintaining the overall workload distribution. Then, use "Additional cards" to account for the remaining work (1800 in this case) and generate a forecast that considers the entire project scope.
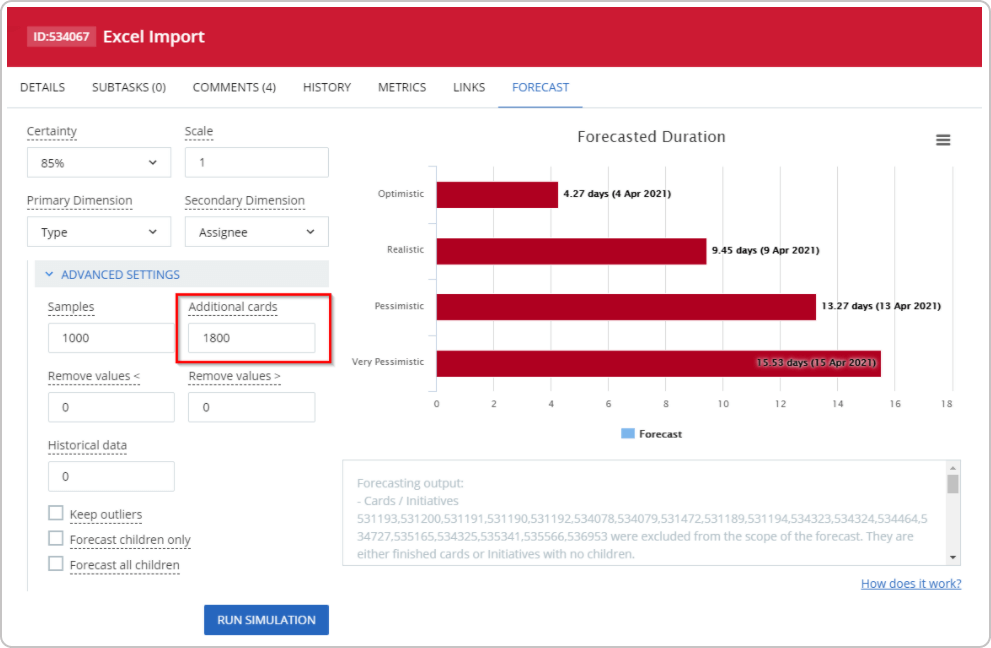
This approach allows you to create a workable initial forecast without getting bogged down in excessive detail.
3 Ways Project Forecasting Helps You
Let's take a look at some of the key benefits of project forecasting, including a common use case.
-
Be predictable - This is a common topic among PMs. The problem is that in a knowledge work environment, it's very difficult to give a clear answer because requirements frequently change.
A common use case is when you get asked during a meeting with an important stakeholder. Instead of trying to predict the future, with project forecasting, you can communicate an "optimistic", "realistic," and "pessimistic" variant of project delivery with a given probability. This allows you to factor uncertainty in your plans, create buffers, and reflect your team's real capabilities.
-
Save time from estimating and re-estimating - While estimating can be a necessary evil in the absence of data, it shouldn't be your default approach. Traditional estimating takes valuable time away from actual project delivery. Project forecasting offers a more efficient and insightful approach. By focusing on improving process predictability, you can create a more reliable foundation for your plan. Openly discussing project complexity and team capacity are crucial steps in this process. Once you provide this information, the forecasting algorithm takes over, analyzing historical data and uncertainties to generate a more realistic timeline.
- Quickly adjust your plans - A common scenario for knowledge work projects is for a new scope to be added midway through the project. You don't have to estimate the new work manually when you have an automated system that runs thousands of simulations to predict future outcomes. Just add it to the project, determine how it affects your "scale" factor, and run the simulation.
Start Simple, Refine Gradually: A Recipe for Success
Project forecasting is a broad and complex subject, and I'm only beginning to explore its depths. Many factors must be considered to create accurate forecasts.
Still, the concept is important. You can estimate in the beginning, but ensure that every day, you take another step to making your process more predictable. This will allow you to improve your forecasts continuously and create truly agile project plans.
Businessmap is the most flexible software, helping your company gain visibility across all projects/portfolios, align on goals, and deliver quality work faster.

Pavel Naydenov
Marketing Professional | Kanban & PPM Ops Certified
Pavel is a natural-born optimist with 10+ years of experience in the marketing field. By leveraging Kanban, Lean, and Agile practices for years, he drives brand growth and engagement through data-driven marketing strategies. He believes every message should express the fundamental values of a brand, and if delivered positively, it can change the course of its existence.