Cycle time is a critical metric for businesses striving to optimize their operations and improve efficiency. By understanding cycle time, businesses can identify areas of improvement and make data-driven decisions to reduce delivery times, increase productivity, and ultimately improve the bottom line. Originating from Lean manufacturing, cycle time plays a vital role in healthcare, software development, and service industries, where efficiency is a top priority.
We will explore cycle time in detail, including its definition, importance, and how it can be measured. We will also discuss the factors that affect cycle time. Additionally, we will examine the differences between cycle time and other related metrics, such as lead time and takt time. This comprehensive guide will give you a thorough understanding of cycle time and its relevance to your business operations.
What Is Cycle Time?
Cycle time is a flow metric that measures the time it takes to complete a single work item from start to finish. Cycle time is measured from the moment a work item starts to the moment it finishes, including any wait time or downtime in between. Cycle time is an important metric in manufacturing, logistics, and service industries, as it helps to identify bottlenecks, optimize processes, and improve efficiency.
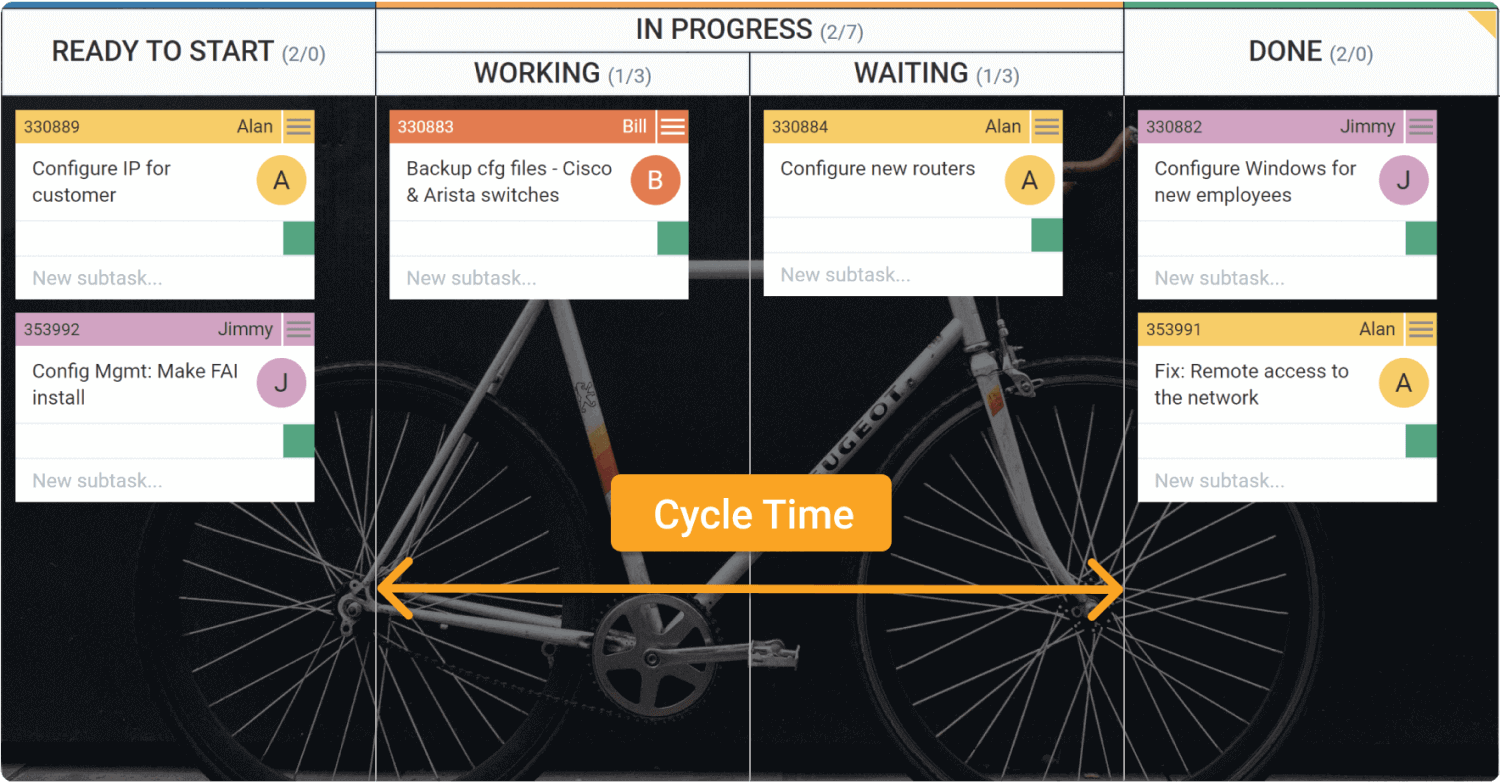
Оn a Kanban board, the cycle time metric usually collects data whenever the work item moves to the "in progress" phase.
 Visualization of cycle time on a Kanban board
Why Does Cycle Time Matter?
Cycle time serves as a crucial metric for teams’ performance. By closely monitoring and enhancing cycle time, organizations can cut down delivery times, satisfy customers and ultimately accelerate their innovation pace.
Streamlining processes by reducing batch sizes and addressing bottlenecks can lead to substantial reductions in cycle time, even for organizations that consider themselves highly efficient.
Relying solely on intuition and perceptions of productivity can be misleading. Hence, integrating quantitative measures such as cycle time tracking not only minimizes biases but also establishes a reliable foundation for continuous improvement efforts.
Cycle Тime vs. Lead Тime vs. Takt Тime
Before we continue with how to measure and calculate cycle time, let’s briefly define cycle time vs. lead time vs. takt time. Lead time and takt time are closely related to cycle time, and often, these metrics can be confusing.
What Is Takt Time?
Takt time is the rate at which you must complete a product or service to satisfy customer demand. Often confused with cycle time, takt time is one of the most important metrics for maintaining a continuous flow. It allows you to utilize your capacity in the best possible way to meet customer demand. You can calculate takt time by dividing the total available time for production by the required production units.
What Is Lead Time?
Lead time is the amount of time that passes from the point a new work item is requested to the point it is completed. Measuring lead time is recommended once a team member has committed to a new work request.
| |
Cycle time |
Lead time |
Takt time |
| Scope |
It involves only the actual working stage - from when the work item goes in progress until it is ready for delivery. |
It involves all stages of work - from when the work item is requested to when it is delivered to the customer. |
Refers to the production rate that a team needs to keep up with to satisfy incoming demand. |
| Goal |
With the help of cycle time, you can gain insights into the areas of the process where work remains idle for a long time so that you can uncover bottlenecks. |
Tracking lead time will help you communicate realistic service level agreements with your customers. Working toward making your lead times more stable will result in the improvement of your overall delivery predictability. |
By calculating takt time, teams can understand the rate at which they need to produce goods or services to meet customer demand. This ensures that production is aligned with customer needs, reducing the risk of overproduction or underproduction. |
| Formula |
Cycle Time = Delivery Date - Start Date |
Lead time = Order delivery date - Order request date |
Takt Time = Total Available Production Time / Average Customer Demand |
How Can You Measure Cycle Time?
Cycle time can be measured by calculating the elapsed time between the start and completion of work items. To do that effectively, you need historical data about your workflow. Digital solutions such as Businessmap (formerly Kanbanize) or other Kanban software can automatically collect data about your workflow and help you measure cycle time through various charts and diagrams.
The cycle time scatterplot is an adapted version of the well-known scatterplot chart. It is revered in the Lean management world because it provides a very detailed picture of one of the key metrics in Lean – cycle time.
Cycle Time Scatterplot visualization
The horizontal axis of the chart visualizes a selected time frame by dates. The vertical one represents the cycle time of the completed tasks during this period calculated in days.
Each dot that you see scattered across the chart is a marker representing a task within a card on your Kanban board. The dots' positions are determined by the date of completion and how long it is required for the Kanban card to reach the done column.
The cycle time scatterplot chart presents clear visualization of the cycle times of multiple similar assignments and provides an easy way to forecast the cycle time of future work items.
How to Calculate Cycle Time?
The formula for calculating cycle time is:
Cycle Time = Net Production Time / Number of Units Produced
Let’s use a simple manufacturing industry example to demonstrate how the formula works.
Cycle Time = Net production time / Total number of units produced
For example, if a manufacturing line runs for 8 hours and produces 400 units during that time, the cycle time would be:
- Cycle time = 8 hours / 400 units
- Cycle time = 0.02 hours per unit or 72 seconds per unit
This means that it takes an average of 72 seconds to produce one unit on the manufacturing line.
Here we are touching on a topic concerning the cycle time formula briefly. Those who are familiar with Lean and Agile know that there are two different ways to calculate cycle time:
- Excluding non-working hours (plus weekends)
- Including non-working hours
This is a controversial topic in many organizations practicing Lean or Agile. Of its complex nature, we have an entire article covering the topic of How to Measure Cycle Time: With or Without Non-Working Hours. We encourage you to read it thoroughly so you can decide what's the best way to calculate cycle time for your organization.
How Can You Reduce Cycle Time?
Different strategies can be used to reduce cycle time.
The first step you can take is to make processes more predictable. This can be achieved by analyzing data and identifying patterns that can help predict how long each step of the process will take. Tools such as cycle time scatter plots and cycle time heatmaps can be used to visualize this data and identify areas where improvements can be made.
The next step is to eliminate waste-generating activities. Activities that do not add value to the process can slow cycle time. Identifying and eliminating these activities can make the process more streamlined and efficient. A cycle time heatmap can be used to identify areas where waste is being generated and to prioritize improvement efforts.
Here are our bonus steps you can take to reduce cycle time:
-
Streamline Processes: Identify and eliminate any unnecessary steps in the process that are causing delays.
-
Optimize Resources: Ensure that the resources, such as people, equipment, and materials, are used efficiently.
-
Improve Communication: Ensure that communication is clear and effective between all parties involved in the process to avoid any delays.
-
Automate Processes: Implement automation technology to speed up manual processes and reduce human error.
-
Implement Lean Principles: Use Lean principles such as continuous improvement to increase efficiency and reduce cycle time.
What Are the Benefits of Calculating Cycle Time?
If you are still not convinced that calculating cycle time is worth the time, just look at some of the benefits of calculating cycle time for your team or organization.
-
Improved productivity: Knowing the cycle time can help identify bottlenecks and inefficiencies in a process, allowing for improvements to be made to increase productivity.
-
Better resource allocation: Understanding the time it takes to complete a project helps to allocate resources more effectively, ensuring that the right amount of time and resources are allocated to each project.
-
Increased customer satisfaction: By reducing cycle time, businesses can improve their delivery times, increasing customer satisfaction.
-
Better planning and scheduling: Knowing the cycle time allows for better planning and scheduling of work, which can help businesses meet deadlines and improve overall efficiency.
-
Increased quality: By tracking cycle time, it is possible to identify and eliminate defects and errors in the process, resulting in higher-quality output.
Cycle Time Frequently Asked Questions (FAQs)
What Is the Inventory Cycle Time?
Inventory cycle time is the amount of time it takes to manufacture and deliver an order from a customer. This metric measures the efficiency of a company in completing the manufacturing or assembly process, converting raw materials or components into a marketable product.
What Is Cycle Time in Manufacturing?
Cycle time in manufacturing is a metric that calculates the total time it takes to process raw materials into a completed product.
What Is the Difference between Lead Time and Cycle Time?
One of the key differences between lead time and cycle time is that cycle time tracks the duration from when a task enters "in progress" to its completion, while lead time measures the time from the appearance of a new work request to its final completion.
Businessmap is the most flexible software
to achieve full work visibility across teams and portfolios
In Summary
Cycle time is one of the most important Lean/Agile metrics. By measuring cycle time for your workflow, you can:
- Provide you with valuable information about your workflow.
- Make processes more predictable.
- Help you to identify bottlenecks in your workflow.
- Eliminate waste-generating activities.
- Understand better your team’s work capacity.


 Visualization of cycle time on a Kanban board
 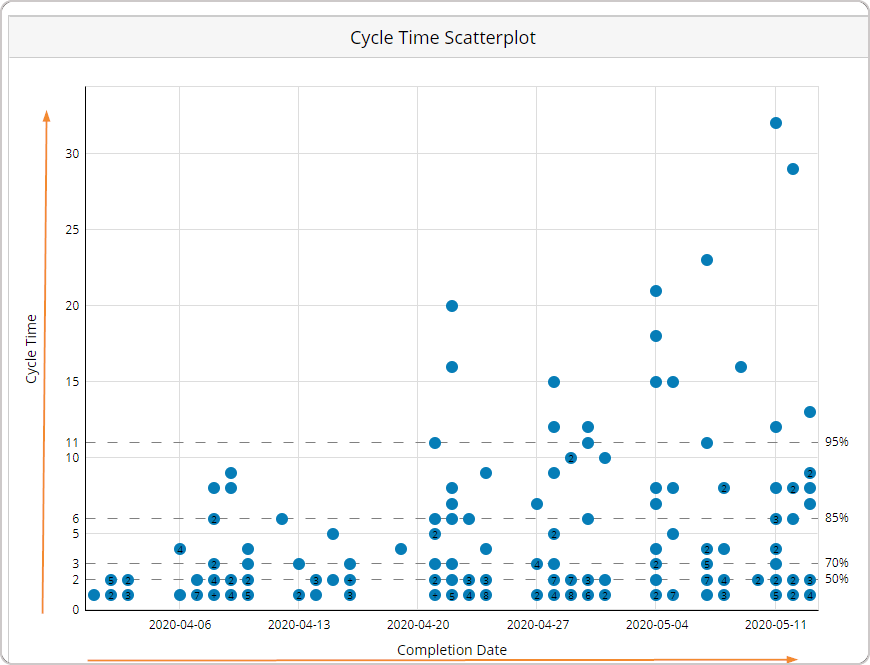 Cycle Time Scatterplot visualization