It's essential to understand the distinctions between cycle time and lead time when it comes to good process management practices. Cycle time is a metric that refers to the time it takes to complete a single task. In contrast, lead time encompasses the entire process duration from start to finish, including any waiting periods or delays - essentially, cycle time is a part of lead time.
Understanding these differences is crucial for optimizing workflows, identifying bottlenecks, and boosting productivity and customer satisfaction.
Defining Cycle Time and Lead Time
Cycle time and lead time are two essential metrics in the Lean philosophy. Measuring the cycle and lead times of a process can help you better understand how work progresses over time. The analysis can uncover where problems lie in the workflow and how to optimize business processes to ensure the timely delivery of products/services to the end customer.

What Is Cycle Time?
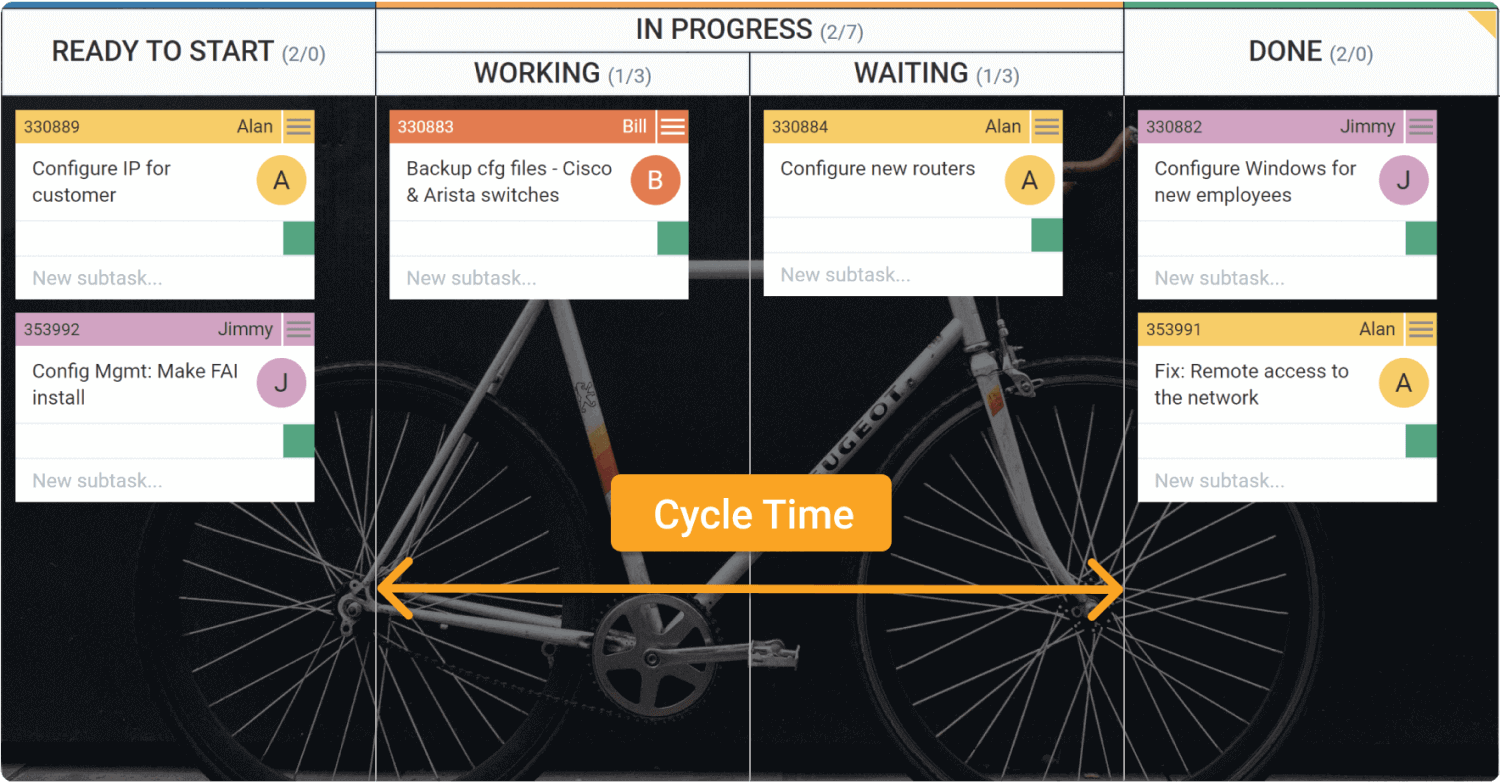
Cycle Time is the amount of time a team or person spends actually working on a work item until it is ready for delivery.
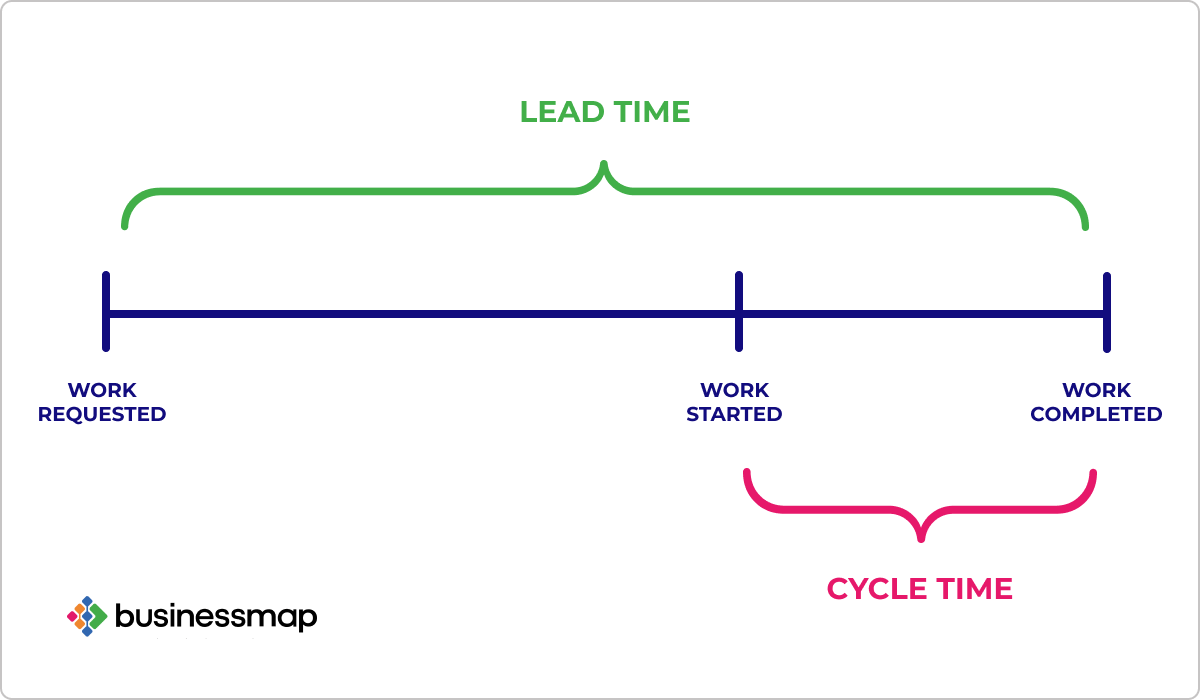
While lead time measures the whole process since the arrival of new demand, cycle time analyzes areas where teams are actively adding value to the work at hand. In other words, on a kanban board, the cycle time metric usually collects data whenever the work item moves to "in progress".
Visualization of a workflow cycle time on a kanban board
You need to monitor your overall WIP to maintain a stable workflow cycle time. Professor John Little (Institute Professor at MIT) concluded, after various types of research, that the more work we have in progress, the greater the system's cycle time.
The equation became famous as Little's law, and the cycle time formula looks like this:
Cycle Time = Work in Progress / Throughput*
*In the formula above, throughput is the total number of work items that pass through the process over a certain period. On the other hand, work in progress (WIP) looks at how much active work lives in the system on average.
What Is Lead Time?
Lead time is the amount of time that passes from the time a new work item is requested to its completion.
In Kanban, it's recommended that lead time be measured once a team member has committed to a new work request (i.e., once the request has exited the backlog and reached the commitment point in the process).
Visualization of a workflow lead time on a kanban board
This way, the average lead time in a Kanban system will be much more accurate. Otherwise, you can have hundreds of new work items that can spend months in a waiting queue before somebody can start them. As a result, lead times will increase dramatically.
Lead Time vs. Cycle Time: Comparing the Essentials
While both metrics give you insights into how quickly you deliver value to your customers, let's summarize the differences in the table below:
| Cycle Time |
Lead Time |
| Cycle time starts when new work enters a work process's "in progress" area, and somebody starts to work on it. |
Lead time measures the period between a new work request appearing in a workflow and its final departure from the system. |
| Provides information about the team's value-adding production rate. |
Provides information about the overall value delivery process. |
| With the help of cycle time, you can gain insights into the areas of the process where work remains idle for a long time, so that you can uncover bottlenecks. |
Tracking lead time will help you communicate realistic service level agreements with your customers. Working toward stabilizing your lead times will improve your overall delivery predictability.
|
How to Measure Cycle Time and Lead Time in Kanban?
Collecting historical data on your workflow is essential to measuring cycle time and lead time effectively in Kanban, ideally through automated tracking. One of the most effective tools for this purpose is the Cumulative Flow Diagram (CFD). This chart visually represents all work items entering your workflow and tracks the accumulation of completed tasks over time.
Visualizing lead and cycle time using cumulative flow diagram
- To measure lead time, configure your CFD to track data from the moment a new task enters the "Requested" (or waiting) column. This captures the entire duration from when the work is requested until completion.
- For cycle time, adjust your CFD to measure data from the point when a task moves into the "In Progress" (or activity) column. This reflects the time it takes to complete the task once work begins.
The Cumulative Flow Diagram offers a clear and quick overview of the average lead and cycle times over a selected period, allowing you to monitor and optimize your workflow effectively.
10 Years Kanban Experience In 1 Free Book.
Project Manager's Guide to Kanban
How to Shorten the Gap Between Lead Time and Cycle Time?
To shorten the gap between lead time and cycle time, it's crucial to address the delays that occur when a work item sits in a waiting column before a team member can begin working on it. These delays contribute to a larger gap between lead time and cycle time, ultimately slowing down the overall completion of tasks.
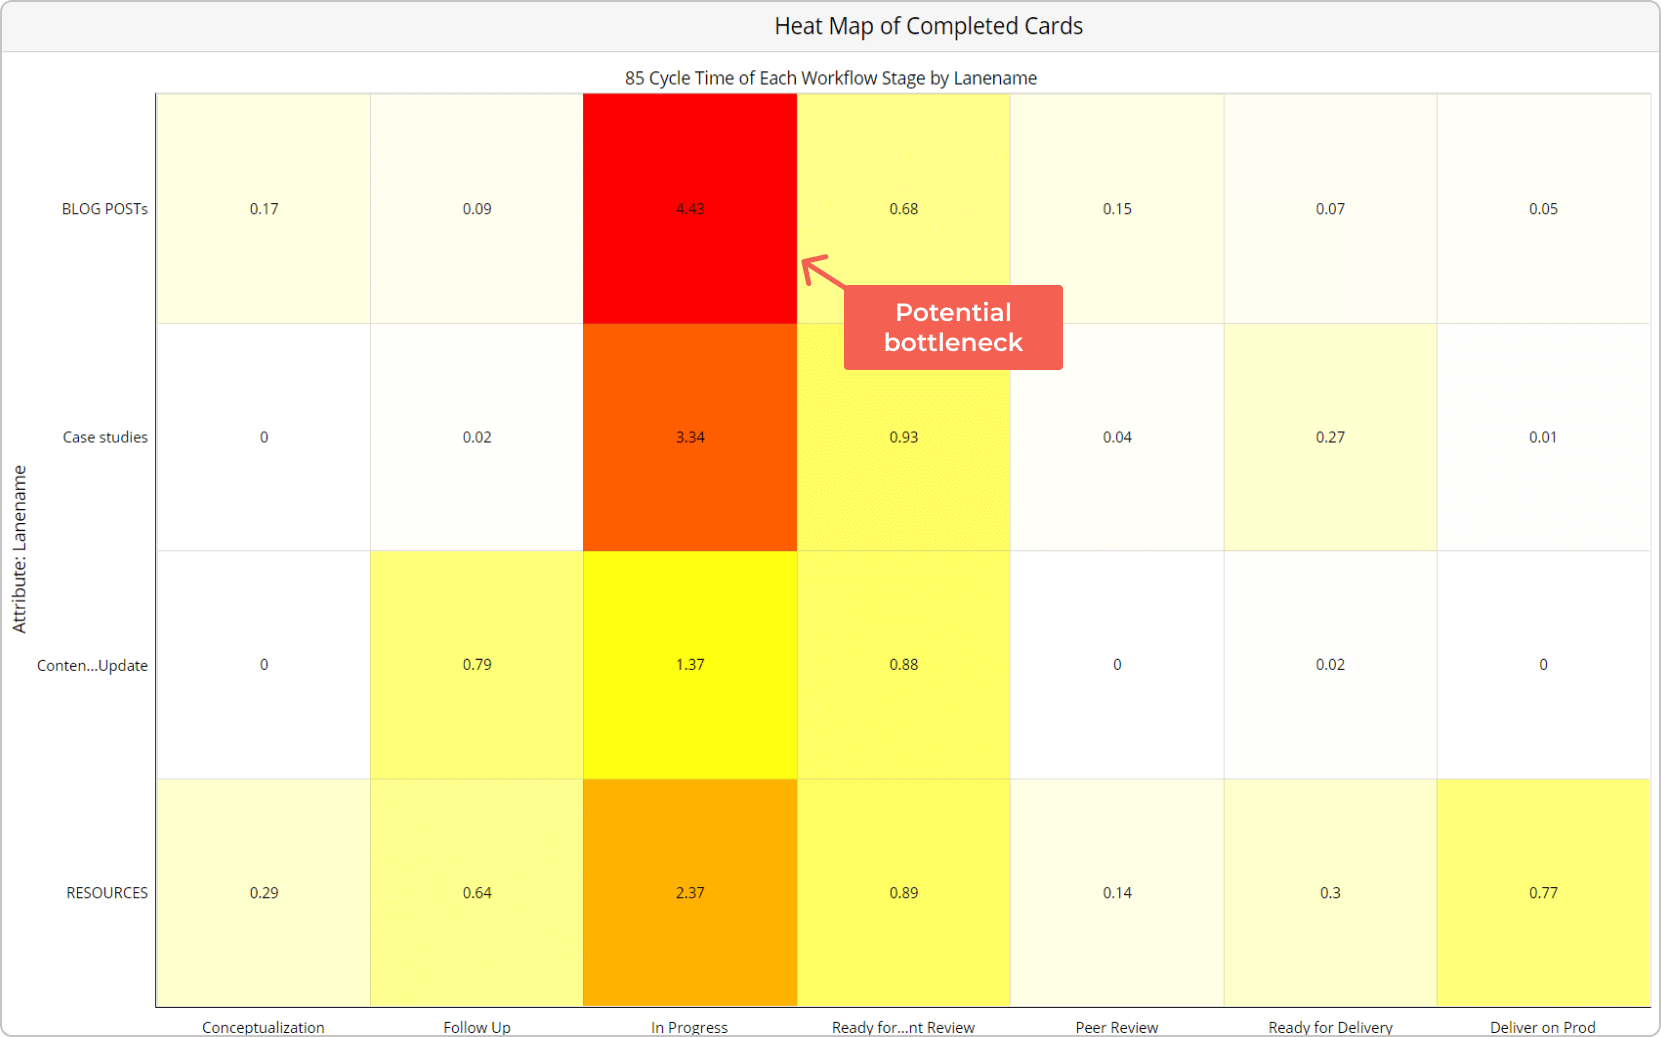
To identify the root cause of these delays, you can utilize two key cycle time charts, the Cycle Time Scatter Plot and the Cycle Time Heat Map, available in the analytics panel of our software platform.
The Cycle Time Heat Map provides detailed insights into the cycle time of all work items over a specified period. It allows you to pinpoint tasks that took longer to complete and highlights areas where inefficiencies may exist.
Visualizing a potential work process bottleneck using cycle time heat map
The Cycle Time Scatter Plot, on the other hand, offers a visual representation of the total time work items spend in each stage of your kanban workflow. This chart helps you assess the predictability of your process once a team member begins working on a task, making it easier to identify stages that cause delays.
Visualizing the average cycle time trend of a work process using cycle time scatterplot
By using these tools, you can effectively locate problematic areas in your workflow and take corrective actions to eliminate bottlenecks. Remember that workflow is dynamic and constantly evolving, so it's essential to regularly monitor your processes and use the appropriate analytical tools. This ongoing analysis enables you to make necessary adjustments, enhancing your team's efficiency and reducing the gap between lead time and cycle time.
Optimizing Cycle Time: The SCHLENK Case Study
A practical example of optimizing cycle time through Kanban can be seen in SCHLENK's case study. A leader in the chemical industry, SCHLENK achieved significant reductions in cycle time and increased throughput by concentrating on flow management and process optimization.
Using Kanban analytics, including the Cycle Time Scatter Plot and the Cumulative Flow Diagram, SCHLENK identified and addressed workflow bottlenecks. This analysis examined task delays and process stability, leading to strategic adjustments such as frequent review meetings and implementing Work-In-Progress (WIP) limits.
These efforts dramatically reduced one team's cycle time from 110 days to just 44 days, along with enhanced overall throughput. This case study highlights the effectiveness of continuous improvement efforts supported by the right tools and practices.
Businessmap is the most flexible software
to achieve full work visibility across teams and portfolios
In Summary
Lead time and Cycle time are powerful statistics that:
- Provide you with valuable information about your workflow.
- Help you to identify bottlenecks in your workflow.
- Can help for a better understanding of your team’s work capacity.


 Visualization of a workflow cycle time on a kanban board
 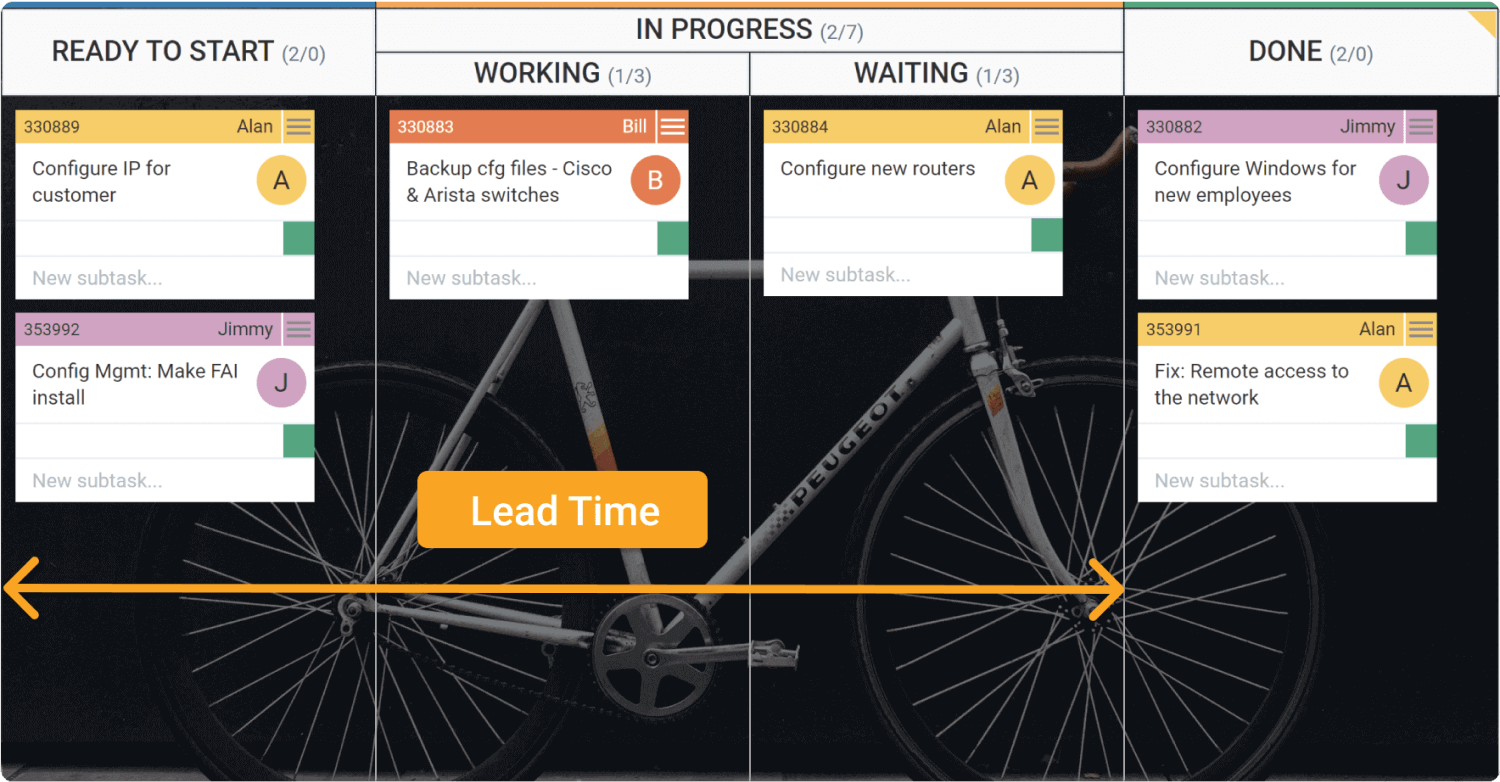 Visualization of a workflow lead time on a kanban board
 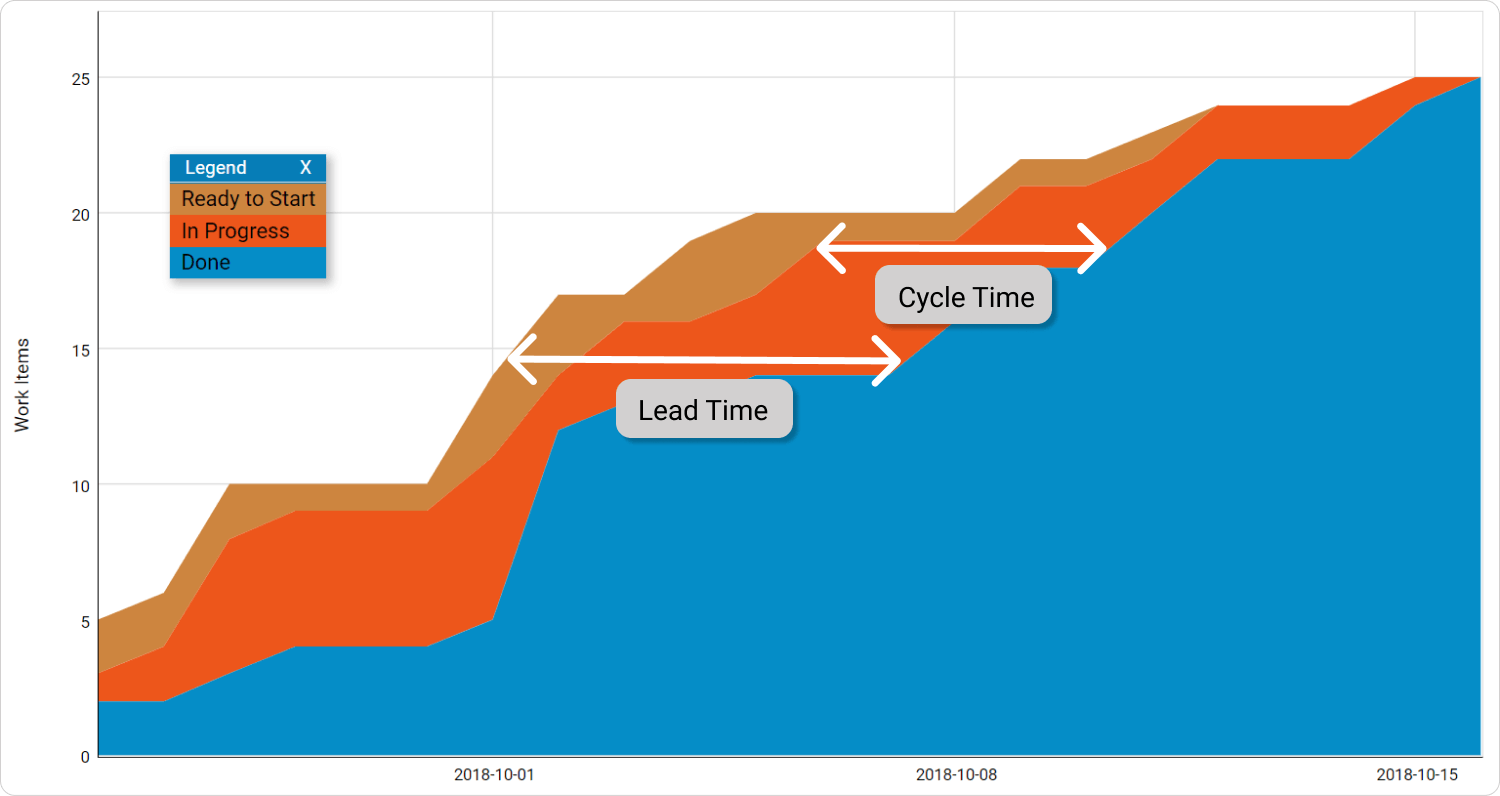 Visualizing lead and cycle time using cumulative flow diagram
 Visualizing a potential work process bottleneck using cycle time heat map
 Visualizing the average cycle time trend of a work process using cycle time scatterplot