Monday's plan looks manageable. By Wednesday, three urgent requests have landed, two people are double-booked, and someone is working through lunch to keep a deadline alive.
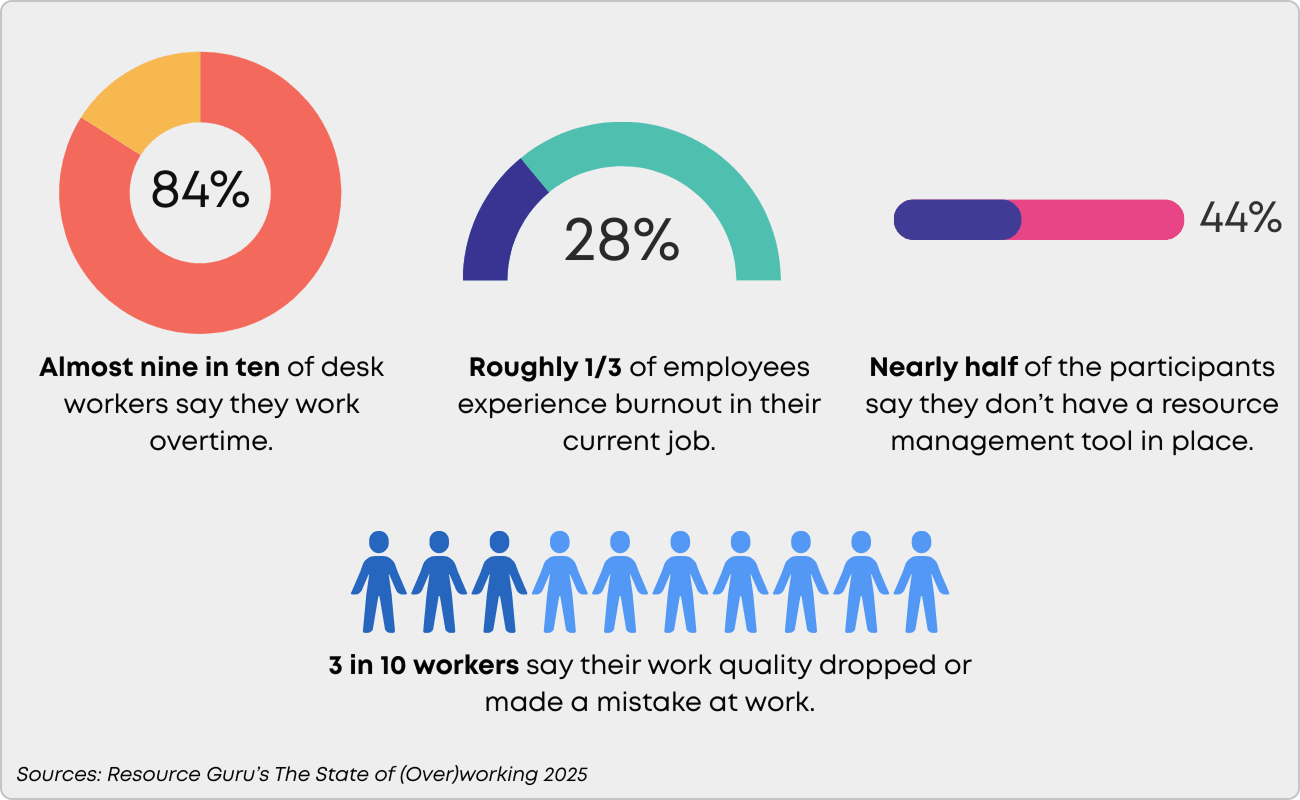
That's not a scheduling hiccup. It's a major capacity planning failure, and Resource Guru's 2025 survey of 2,000 UK desk workers confirms how widespread it is. 84% work overtime, 28% have experienced burnout, and 44% have no scheduling or planning software at all.
The good news is that most of these problems are fixable once you make capacity visible. Here is what goes wrong, what it actually costs, and how visual workflow management can turn things around.
What is the real cost of poor capacity planning?
Capacity planning breaks down when teams lack visibility into what everyone is actually working on. Without that picture, managers estimate availability based on gut feel, outdated spreadsheets, or the assumption that people will just absorb more work. They usually do, until they cannot.
Resource Guru's survey found that 68% of desk workers work weekends, and 25% have felt guilty for leaving on time. Meanwhile, 44% of respondents said their organization uses no dedicated resource scheduling software, relying on Google Sheets or nothing at all. When workload is invisible, overallocation is inevitable.
Agency and client-facing teams take the hardest hit. Among agency workers surveyed, 43% said they routinely put client needs above their own well-being, and 32% cited demanding clients as a direct cause of burnout. Without a visual project management system that shows when a team is at capacity, saying "we can't take this on right now" feels like a guess rather than a fact.
The consequences go beyond tired employees. Of those who experienced burnout, 52% took time off work and 35% said the quality of their output suffered. Sleep problems affected 49% of workers dealing with work-related stress, and 49% reported frequent headaches. These are not minor side effects. They are signals that the system itself is broken.
How does visual workflow management fix team capacity planning?
The core issue behind every stat above is the same: teams cannot manage what they cannot see. Visual workflow management solves that by making work, bottlenecks, and available capacity immediately obvious.
Make capacity visible in real time
When all tasks live on a visual Kanban board, you can see at a glance who is overloaded and who has bandwidth. That sounds basic, but consider that 44% of workers surveyed have no planning tools at all. For those teams, capacity is a black box.
Businessmap's work boards display every active task, its status, and its owner in one view. Instead of chasing updates through email threads or stand-ups, managers can spot overallocation before it turns into overtime. When a new request lands, the board shows exactly what it would displace.
Enforce capacity limits with WIP constraints
Visibility alone is not enough if the response to an overloaded board is still "just squeeze it in." Work-in-progress (WIP) limits create a hard boundary: once a team hits its limit, new work cannot enter the queue until something else finishes.
This directly addresses the "one more thing" problem that drives so much unplanned overtime. With WIP limits in place, adding a task forces a conversation about what gets deprioritized. For agency teams where 43% default to absorbing whatever the client asks, that forced conversation changes the dynamic entirely. The limit becomes a shared, objective reference point rather than a subjective pushback.
Plan for realistic capacity
Most capacity plans fail because they are built on theoretical availability: eight hours a day, five days a week, minus holidays. Real capacity is much lower once you account for meetings, admin, context switching, and the unpredictable client requests that dominate agency life.
Tracking how work actually moves through your team - measuring cycle time and identifying where tasks stall - would be cumbersome without workflow metrics and AI insights offered by modern visual project management platforms. With Businessmap, for example, you can instantly interpret this data from your charts to get actionable insights into team performance, bottlenecks, and capacity trends without manual effort.
Over time, this data replaces guesswork with evidence. You stop planning around how much work people should be able to do and start planning around how much they actually can.
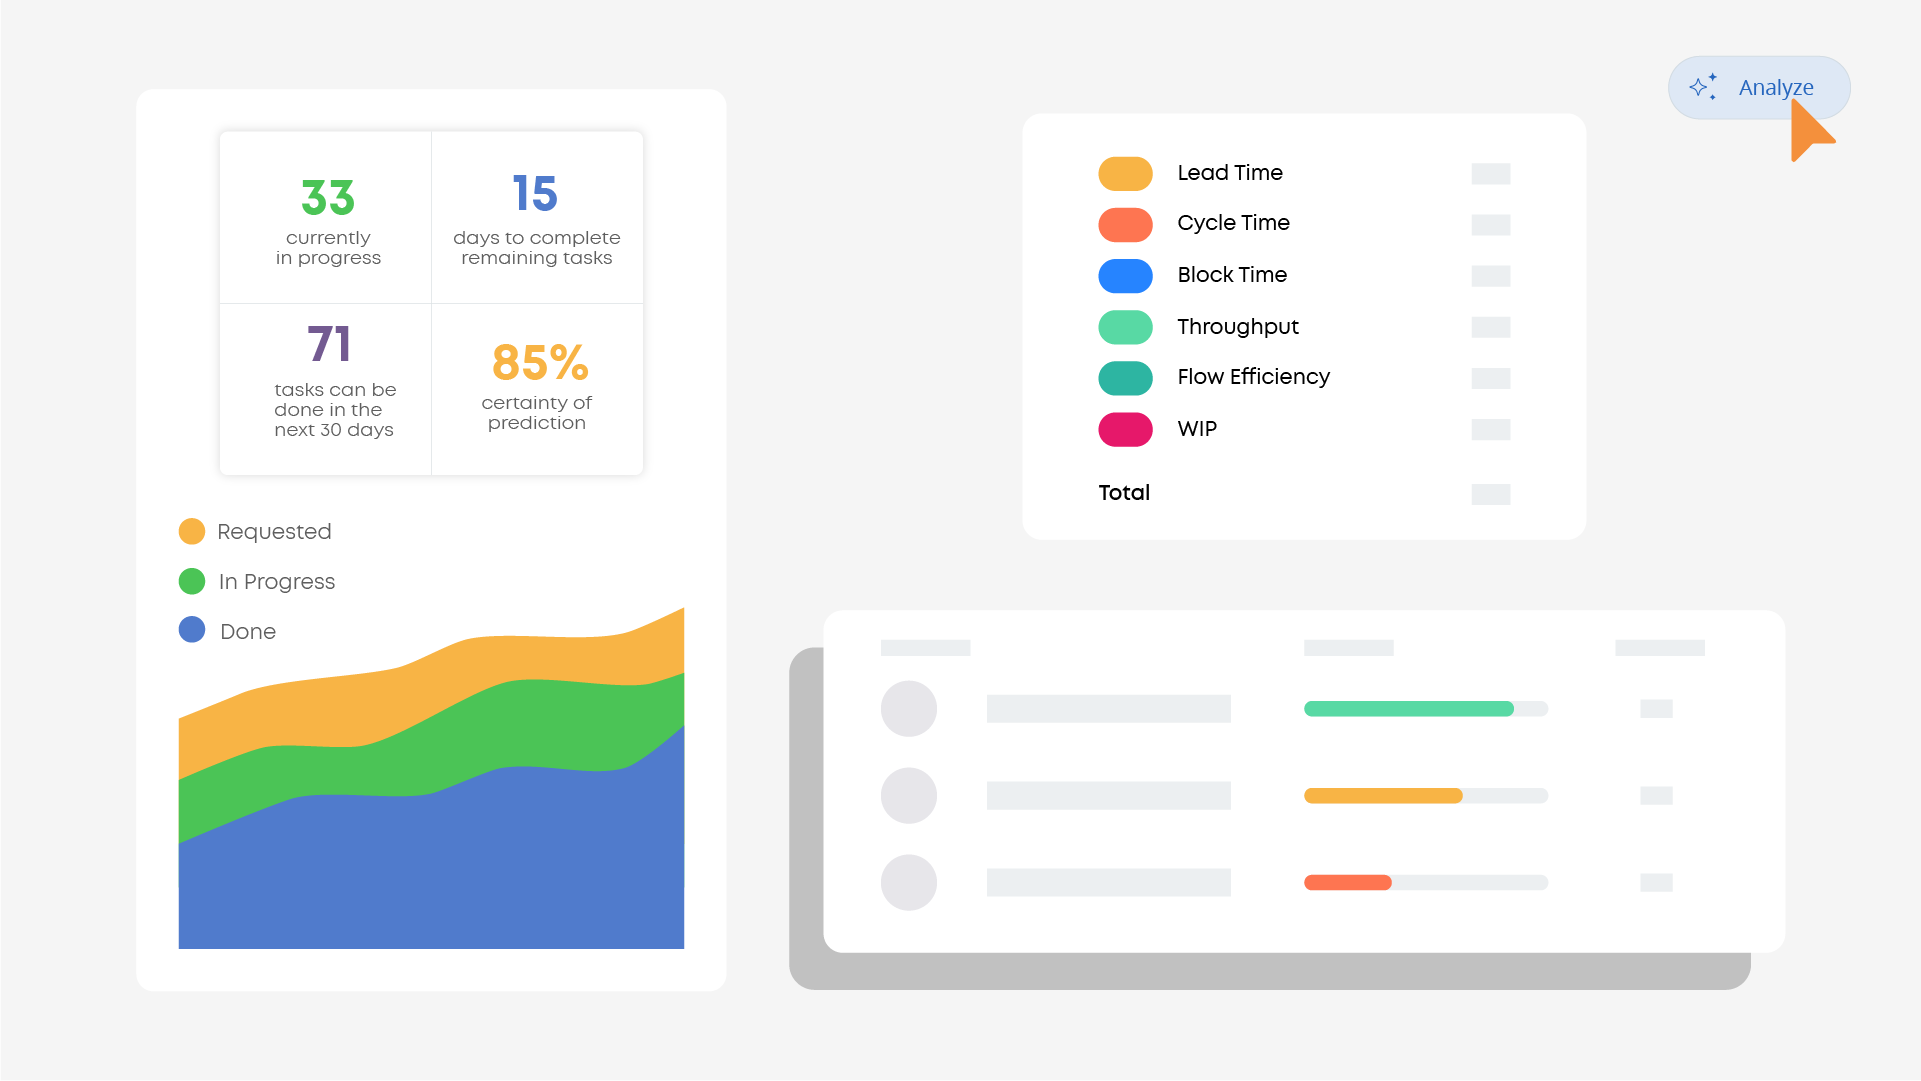 Analyze and read every work process performance instantly with AI-powered insights in Businessmap
How do you put team capacity planning into practice?
If your team is running on spreadsheets or no planning tools at all, the shift to visual capacity management does not need to be complicated. A practical resource capacity planning guide can help you forecast demand, calculate real capacity, and build a repeatable planning process. Start with these steps:
- Map all current work onto a visual board. Get every active task, ongoing project, and standing commitment into one place. The goal is a single source of truth that shows your team's full workload. This alone often reveals overallocation that was previously invisible.
- Set WIP limits based on actual capacity. Use your team's real throughput data rather than theoretical maximums. If your team consistently finishes five projects per sprint, do not plan for eight.
- Review and adjust weekly. A quick weekly capacity review catches problems early. Look at what is in progress, what is queued, and whether WIP limits are being respected. Adjust before workloads spiral rather than reacting after someone burns out.
- Build buffers for client volatility. If your team handles client-facing work, leave capacity slack for the inevitable urgent requests. With 32% of agency workers citing demanding clients as a burnout trigger, planning at 100% utilization is planning to fail.
Consider a team using a digital kanban board to manage mixed projects and client work. Their board shows all active tasks with WIP limits per column. When a client's escalation arrives, the team does not just absorb it. They look at the board, identify what can be paused, and make the trade-off explicit. The client gets what they need; the team keeps their workload sustainable.
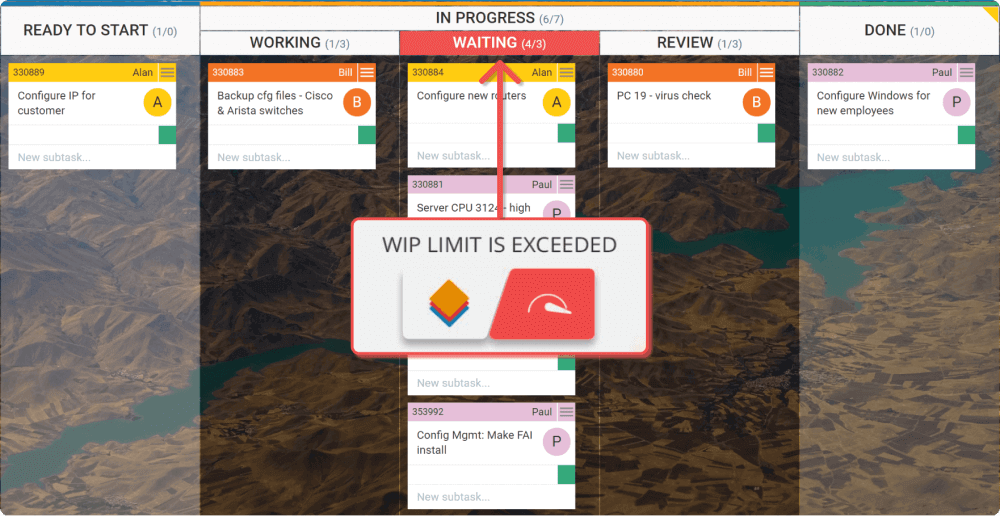 Apply WIP (Work-In-Progress) limits on a Kanban board in Businessmap
Capacity planning is a well-being issue
Poor capacity planning goes beyond just being an operational problem. When 84% of workers are doing overtime and 28% have hit burnout, it's a wellbeing crisis hiding behind a process gap. The data on overworking in the UK makes the scale clear, but the fix is within reach.
Visual workflow management makes capacity tangible and enforceable. When work is visible, limits are set, and planning is grounded in real data, teams stop firefighting and start operating sustainably.
The starting point is straightforward: make your team's capacity visible this week. Map the work, set the limits, and give your people the breathing room they have been missing.
Explore how Businessmap can transform your work management system.

Michaela Toneva
Kanban & Agile Practitioner | SEO & Content Creator
With a never-ending thirst for knowledge and a passion for continuous improvement, Michaela is an Agile practitioner with a good understanding of Kanban, Lean, and Agile methodologies. Her professional background includes SEO and content writing with a dose of sales and a pinch of social media.