Key Takeaways
- Visual project management uses boards, charts, and dashboards to make work progress and bottlenecks instantly visible.
- It enables faster decisions, clearer priorities, and better alignment than traditional methods.
- Start small, measure impact, then scale with a balance of standardization and flexibility.
Projects often fail not because teams lack skill, but because they lack visibility. Deadlines slip, priorities change, and small problems grow into major delays - hidden in spreadsheets, buried in reports, or discussed too late in meetings.
Visual project management changes this dynamic. Making plans, priorities, and bottlenecks visible in real time gives leaders and teams a shared understanding of the work. Instead of asking for a status update, you can see the truth in seconds.
This guide answers the most common questions leaders have about visual project management - what it is, why it works, which tools to start with, how to roll it out successfully, and how to scale it across an organization without losing consistency. You'll also see how leading companies, such as Aerosud, use it to manage complex, multi-portfolio work.
Run projects. See portfolios. Deliver results. All in a single place.
What is visual project management and how is it different from traditional project management?
Visual project management is a way of planning, tracking, and delivering work using visual tools like Kanban boards, Gantt charts, timelines, and dashboards. The aim is to replace static, text-heavy updates with dynamic, real-time visualizations that make the "state of play" obvious to everyone.
The difference from traditional project management comes down to speed and transparency.
| Traditional Project Management |
Visual Project Management |
| Static documents and reports |
Live boards and dashboards |
| Siloed updates in email or meetings |
Shared, transparent workspaces |
| Risks found after they happen |
Risks visible as they develop |
| Periodic, formal status updates |
Continuous, in-context updates |
»» Example scenario: You're leading a product launch. In a traditional model, you might find out during a Monday meeting that a design task is two weeks late - putting the launch at risk. In a visual system, you'd notice midweek that the "Design" column is overflowing, prompting you to shift resources before the delay spreads.
Common misconceptions about visual project management
-
It's just Kanban boards: Kanban is one technique, but the approach also includes timelines, roadmaps, and dependency maps.
-
It's only for Agile teams: It benefits marketing, operations, manufacturing, construction, and more.
-
It's set-and-forget: Visual systems must be updated and refined to stay effective.
What are the main benefits of implementing visual project management in your organization?
The benefits extend beyond "looking nice." When implemented well, visual project management delivers measurable and cultural improvements.
✔ Immediate clarity
A well-designed board makes it obvious who's doing what, where work is piling up, and which tasks are ready to start.
✔ Faster decision-making
When risks surface early, leaders can reassign resources or adjust priorities before deadlines are at risk. For example, seeing a stalled dependency chain can prompt cross-team intervention before the schedule slips.
✔ Better engagement
Visuals are more accessible than dense documents - team members don't need project management training to understand progress. This inclusivity often leads to higher participation in status reviews and retrospectives.
✔ Stronger alignment
Linking strategy to execution visually helps everyone see how daily tasks connect to organizational goals. This reinforces purpose and reduces "busy work" that doesn't add value.
Which visual project management tools and techniques should you start with?
If you're new to visual project management, aim for quick wins with techniques that fit your workflow.
Start with:
-
Kanban boards: Columns like "To Do," "In Progress," and "Done" help manage ongoing work. You can add swimlanes for different priorities or work types.
-
Gantt charts: Useful for projects with strict timelines and dependencies, like product launches or event planning.
-
Timeline views: Ideal for presenting delivery schedules to executives or clients.
-
Dependency maps: Reveal how deliverables link, helping avoid last-minute roadblocks.
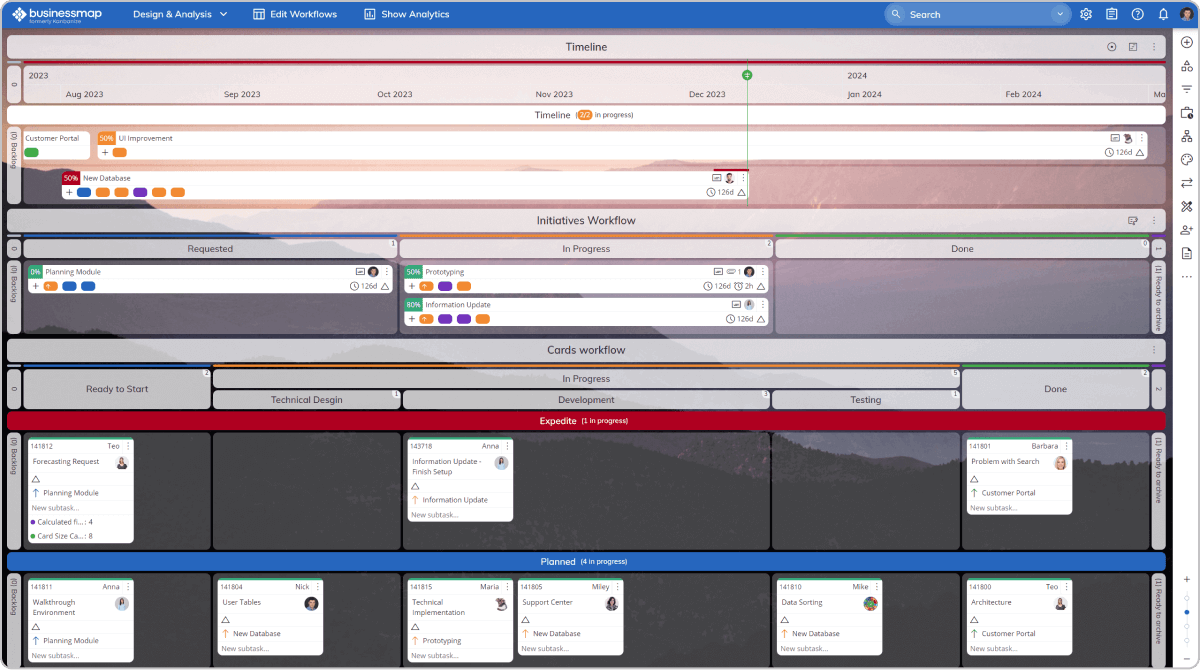
»» Practical tip: Choose a visual project management tool that allows multiple views of the same work. In Businessmap, for example, a task can appear in a Kanban board for the team, a timeline for managers, and a portfolio view for executives - all without duplicating effort.
 Visualizing a work management board with timeline, project and indivisual work items views in Businessmap
Choosing the right level of visualization
A common mistake is trying to visualize everything at the same level. Instead:
-
Portfolio view: Tracks strategic programs and initiatives.
-
Team view: Displays the daily workflow of delivery teams.
-
Individual view: Helps manage personal tasks and deadlines.
Businessmap is the most flexible software
to gain full work visibility across teams & portfolios
What is the best step-by-step approach to implement visual project management without causing team resistance?
Rolling out visual project management is as much about change management as tool setup. This five-step approach minimizes friction:
1. Identify pain points
Pinpoint where work is getting lost, updates are slow, or priorities are unclear.
2. Run a pilot
Select one willing team and a project with clear boundaries to demonstrate early wins.
3. Co-design the workflow
Let the team define board stages, work-in-progress limits, and naming conventions.
4. Train and support
Show how the system saves time, reduces meetings, and increases clarity. Provide quick-reference guides and regular Q&A sessions.
5. Review and adapt
Use retrospectives to refine the process before scaling to other teams.
»» Field insight: In my experience, once teams realize the board replaces most status meetings and email chains, resistance fades quickly. They start seeing it not as "extra work" but as a simpler way to work.
How to measure the success and ROI of visual project management implementation
The best measurement approach combines quantitative and qualitative indicators.
Track these metrics:
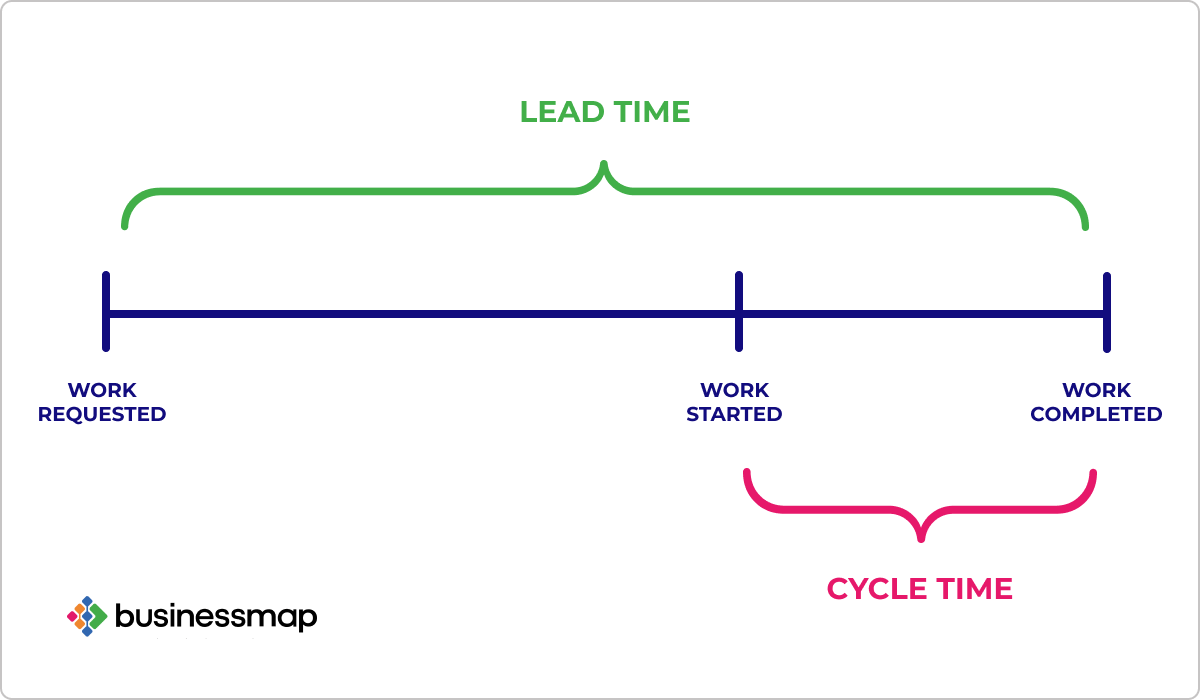
- Lead time (from request to delivery)
- Cycle time (active work duration)
- Throughput (tasks completed per period)
- On-time delivery rate
Also look for:
- Higher team satisfaction
- More confidence from stakeholders in reported progress
- Fewer emergency escalations
»» Practical tip: Don't just measure after implementation - capture baseline data before rollout. That way, you can clearly demonstrate improvements when presenting results to leadership.
How to scale visual project management across multiple teams while maintaining consistency and continuously improving
Scaling visual project management successfully requires a balance between standardization and team autonomy.
Key actions:
- Set organization-wide standards for naming, color coding, and metrics.
- Allow local customization so teams can adapt boards to their specific workflows.
- Run regular feedback loops to identify and share best practices across teams.
Case Study Spotlight: Aerosud
Aerosud, a leading aerospace manufacturer, needed to coordinate complex projects across engineering, production, and support. They implemented multiple interconnected visual project management boards in Businessmap, linking every level of work from strategic portfolios to individual tasks.
This approach gave them:
-
Unified visibility across all portfolios and teams.
-
Clear dependency mapping to prevent bottlenecks in production.
-
Faster, automated reporting for executives - no more manual status collation.
By maintaining a consistent portfolio view while allowing teams flexibility in execution boards, Aerosud achieved alignment, speed, and continuous improvement across the organization.
»» Read the full Aerosud case study
Start small, measure & scale
Visual project management is more than a way to make work look tidy - it's a proven method for improving clarity, accelerating decisions, and aligning daily execution with strategic goals.
The key is to start small, measure impact, and scale thoughtfully. When done right, visual project management becomes the shared language of your organization - connecting every task, team, and portfolio into a transparent, adaptable system.
If you're ready to explore how connected boards, portfolio views, and analytics can help you implement and scale visual project management, discover what's possible with Businessmap.
Businessmap is the most flexible software
to gain full work visibility across teams & portfolios


 Visualizing a work management board with timeline, project and indivisual work items views in Businessmap