
Delivering value quickly and efficiently is not just an advantage; it's a necessity. With 73% expecting companies to understand their needs and 90% of CX leaders acknowledging that customer expectations are at an all-time high, it's clear that prompt and effective delivery is crucial for customer satisfaction.
But how do you gauge the speed and efficiency of your delivery? The answer lies in understanding and monitoring your 'flow' - a concept critical in Agile project management.
In this article, you will find a compiled overview of:
- What "flow" means in Agile project management
- The importance of flow metrics
- Practical methods for measuring flow
Gain the knowledge and tools to improve your delivery process, meet rising customer expectations, and drive your business forward.
What Is Flow in Agile Project Management?
Continuous improvement is one of the foundational pillars of the Agile approach to project management. The goal is to enable greater value delivery, and that's exactly why you need to flow metrics.
Unlike the traditional approach to project management, which focuses on individual performance, managing projects in an Agile environment requires systems thinking. In other words, all processes are intertwined, and flow optimization means improving the performance of both single and multiple teams.
What Are Flow Metrics?
Flow metrics offer insights into the effectiveness and efficiency of a process or system in delivering customer value. Analyzing these metrics enables organizations to make informed decisions, streamline operations, reduce waste, and improve delivery times. Central to the Lean mindset, flow metrics help visualize and quantify critical workflow aspects for continuous improvement.
Here are the essential flow metrics.
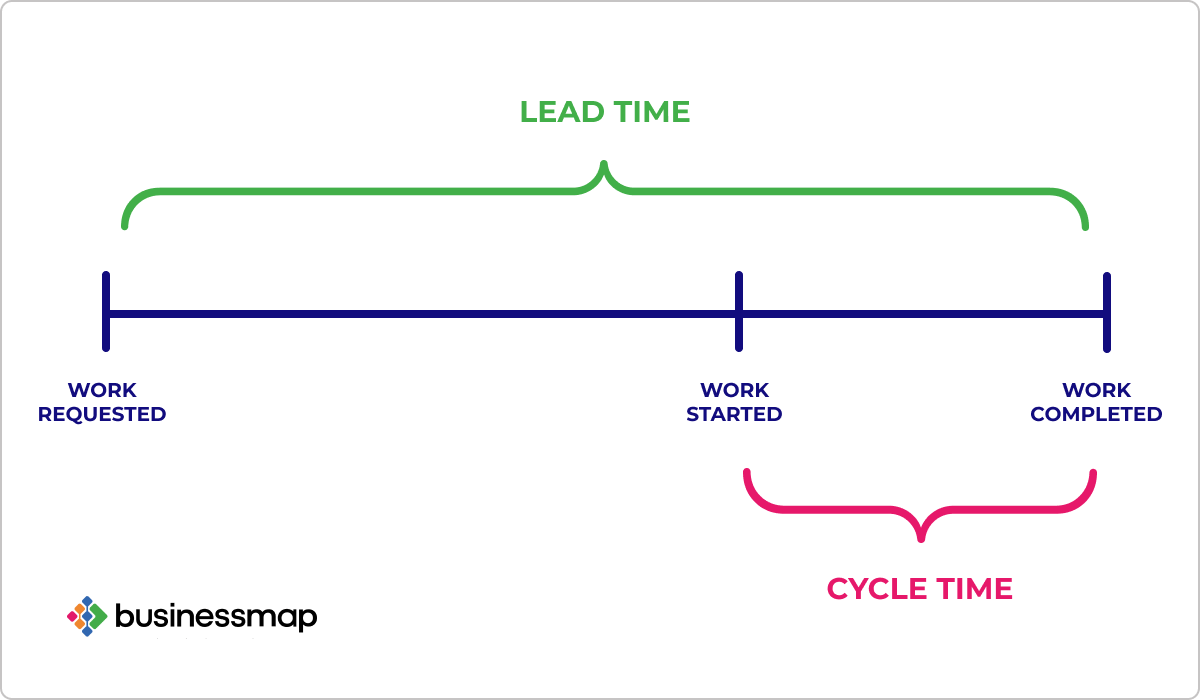
1. Cycle Time and Lead Time
Cycle time begins when a work item enters the active area of a process, and somebody is working on it.
The cycle time metric monitors the work item from the moment it goes to "in progress" to the moment it is completed, and lead time measures the period between the appearance of a new work request in a workflow and its final departure from the system.
Both cycle time and lead time answer questions such as "How long does it take to complete a certain amount of work?" Using these metrics, you can ultimately map your optimization efforts to deliver value faster.
2. Throughput
Throughput measures the number of work items passing through a system over a specific period.
The metric represents the consistency of your delivery rate or how much work you can deliver per a given time period (day, week, month, quarter). Understanding your team's delivery pace will enable better predictability and more accurate forecasts. A good practice is using a system that enables you to accumulate historical throughput data so you can better support your decision-making.
3. Work In Progress
WIP indicates the number of work items in each system that are in progress and shows a team's capacity.
Work in progress provides insights into how much active work lives in your system. The greater the number of unfinished tasks - the greater your cycle time. Measuring work in progress shows how work moves through the various stages of your flow. You can use it to quickly analyze work items that have a high risk of being delayed, monitor the changes in your pace, and spot if there are stages where too much work gets accumulated (bottlenecks).
4. Work Items Age
Work Item Age, or WIP Age, measures the total time that has elapsed since an item entered a workflow, specifically for items still in progress.
WIP age is a critical metric for analyzing workflow efficiency, identifying delays, and ensuring a stable process to improve delivery speed. By monitoring WIP age, you can evaluate teams' past performance in similar contexts, set strategic goals, and facilitate discussions with management and within the team to drive continuous improvement.
5. Flow Efficiency (Bonus)
Flow efficiency is the ratio of the value-adding time to the total lead time required to complete a work item. Measuring the flow efficiency of your workflows highlights the proportion of time spent adding value as opposed to waiting or fixing errors.
Why Are Flow Metrics Important?
Flow metrics are essential tools in the Lean toolkit, enabling organizations to measure, analyze, and improve the flow of value to customers. Analyzing the big picture provides an understanding of how work gets done and allows you to establish a stable workflow. Most of all, the accumulated historical data is an asset for any team.
With metrics, you can answer complex questions such as How predictable is your process? Where does work get stuck? How efficient are your teams? How much work can your teams deliver for a given period?
What Are the Benefits of Measuring Flow?
Flow metrics can be beneficial to every organization and team in the following ways:
- Identify and Eliminate Waste: By pinpointing where delays, bottlenecks, or inefficiencies occur, organizations can focus on eliminating these wastes.
- Increase Process Predictability: By systematically analyzing workflow data, flow metrics allow for the creation of more stable processes and, thus, contribute to faster delivery.
- Improve Customer Satisfaction: By reducing lead times and improving reliability, companies can better meet customer expectations.
- Support Process Optimization: Flow metrics guide decisions on process improvements, capacity adjustments, and workflow optimizations.
- Enhance Flexibility and Responsiveness: Understanding flow helps organizations adapt more quickly to changes in demand or priorities.
How to Use Flow Metrics in Practice?
Whether the context is single or multiple teams, proper measuring of your workflow depends on the number of accumulated work items within your flow.
"The size of a team does not matter, the number of work items delivered is what matters."
Dimitar Karaivanov, CEO Businessmap
How to Use Cycle Time Metrics?
Measuring cycle time is crucial as it reveals your team's production rate trends. Is your team getting slower or faster over time? This information enables accurate future work delivery forecasts. It also identifies stages where work is delayed, helping to pinpoint and address root causes for overall process improvement.
At Businessmap, we effectively measure cycle time using the Cycle Time Heat Map. This tool highlights the stages where work takes the most time, helping us identify bottlenecks. By uncovering these delays, we can continuously work to alleviate them and improve our process efficiency.
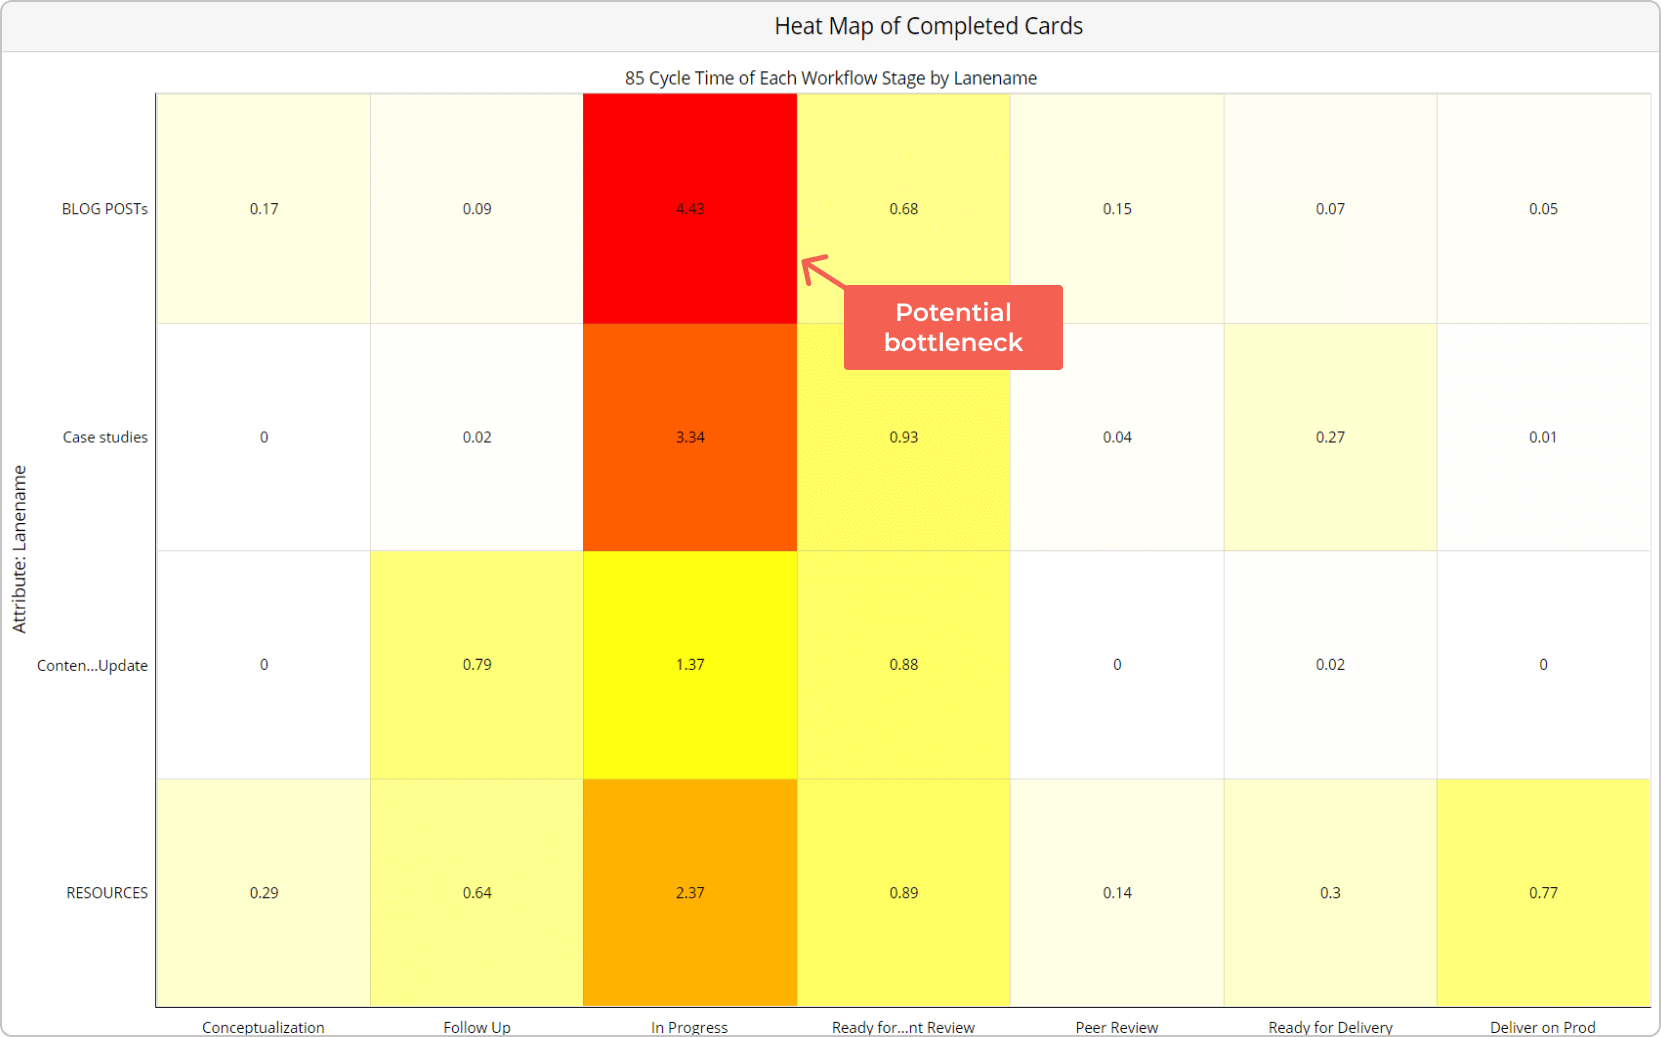
Number of days that work spends in each work stage on a Cycle Time Heat Map
How to Use the Throughput Metric?
Increasing the delivery rate is always a priority for successful project managers. Throughput, which tracks the number of work items completed over time, provides crucial insights into work distribution. Analyzing this historical data helps improve delivery capabilities and achieve better predictability.
At Businessmap, we use the throughput metric to gain detailed insights into our workflow. Enhanced visualization of throughput data reveals trends and patterns, serving as a foundation for process improvement. Tools like the Throughput Histogram and the Throughput Run Chart offer extensive customization options, making them ideal for presenting data during our service delivery team meetings.
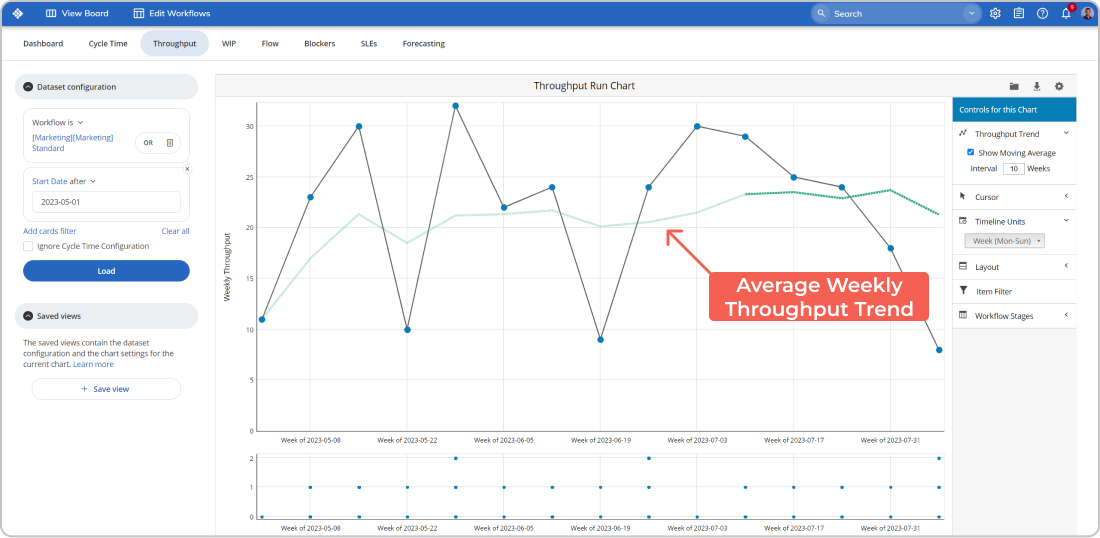
Average weekly throughput trend shown using Throughput Run Chart
How to Use the Work In Progress (WIP) Metric?
Understanding the impact of work in progress is key to unraveling the full potential of the continuous improvement mindset. The number of work items in progress directly impacts your team’s cycle time and throughput rate. Limiting the amount of work in progress helps you become more effective in completing tasks (increasing throughput) and reducing your cycle time. Additionally, continuously measuring WIP provides visibility into your team's real work capacity.
The Aging WIP chart in Businessmap, for instance, shows the items currently in progress and tracks how efficiently we are completing them compared to past performance. Daily monitoring of the Aging WIP helps us analyze where tasks are taking longer compared to similar past instances and triggers team discussions and necessary course-correcting actions.
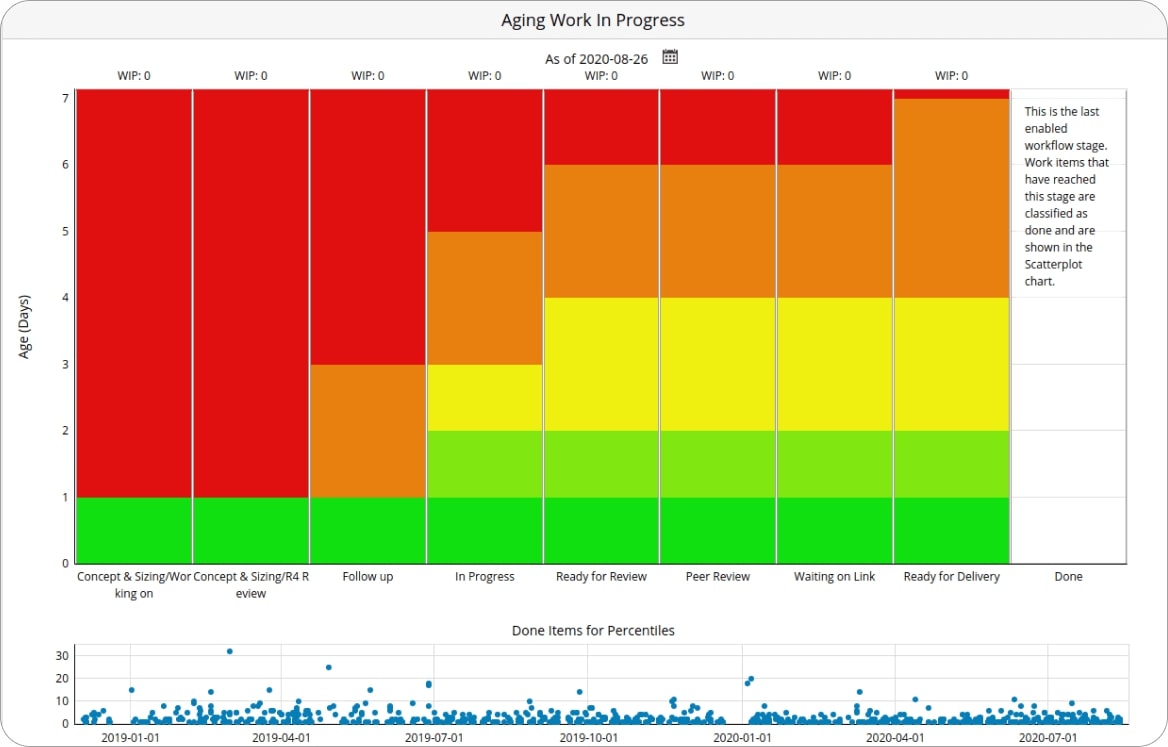
In-progress work items' state shown using the Aging WIP chart
How to Use the Flow Efficiency Metric?
Measuring the ratio between value-adding time and total delivery time narrows down process inefficiencies. Using the flow efficiency metric, you can understand how much time your team spends actively working on tasks and how long work is waiting on something.
Rather than creating reports manually, powerful project management tools offer quicker, smarter, and visually appealing ways to access this data. Tools like the Flow Efficiency Chart in Businessmap visualize waiting stages and track work items' flow, enabling prompt action when non-value-adding time increases.
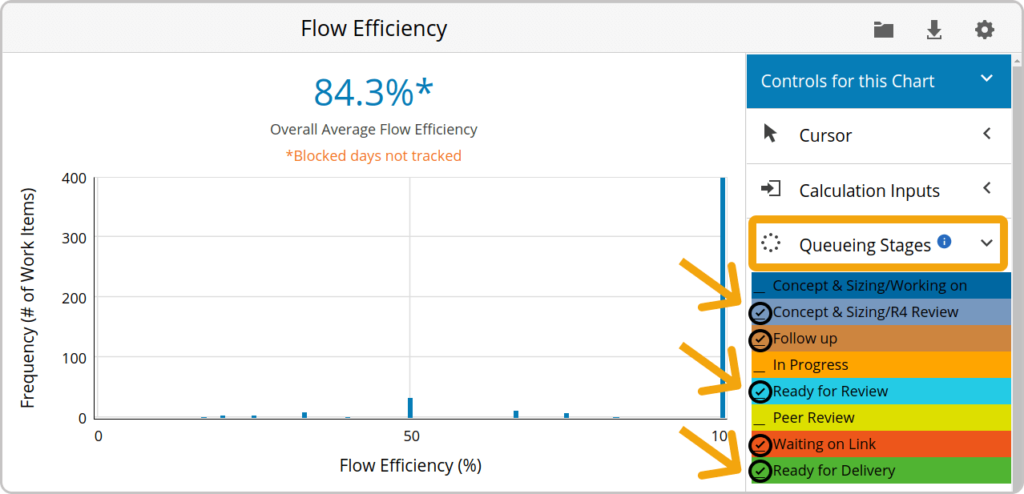
Flow Efficiency chart including "queueing stages" of a workflow
Unlock Data-Driven Continuous Improvement
We hope this article has sparked your interest in exploring and experimenting with flow metrics. Understanding these metrics will help you gain deeper insights into your workflow, establish a predictable process, and emphasize continuous improvement.
With this knowledge, you can start by examining your flow metrics, viewing the big picture, identifying your optimal flow, and driving meaningful improvements.
Businessmap is the most flexible software, helping your company gain visibility across all projects/portfolios, align on goals, and deliver quality work faster.

Iva Krasteva
Content Creator Expert | Agile Practitioner | Kanban Certified
With a background in Intellectual Property, SEO, content writing, and training in Lean, Agile, and Kanban, Iva is an enthusiastic Agile practitioner who embraces collaboration and flexibility every step of the way. Driven by constant learning and knowledge and fascinated by people's creativity.