Portfolio KPIs change. Over time, a clear symbol of value transforms into a dynamic aim that undergoes constant reassessment, revision, or disregard. Dashboards rise, but results don't. This is likely the most common error in digital portfolio management.
Disconnection between plan and action is key. KPIs are at the top, and features are at the bottom. Hope the middle lines connect. Rarely.
While teams focus on velocity, releases, and adoption, leaders consider customer value and expenses. Linking "good" local measurements can hide poor portfolio performance.
Including KPIs in work is the solution. We compare every change to our goals using real-time telemetry, testing, and causal measurement techniques in online data science.
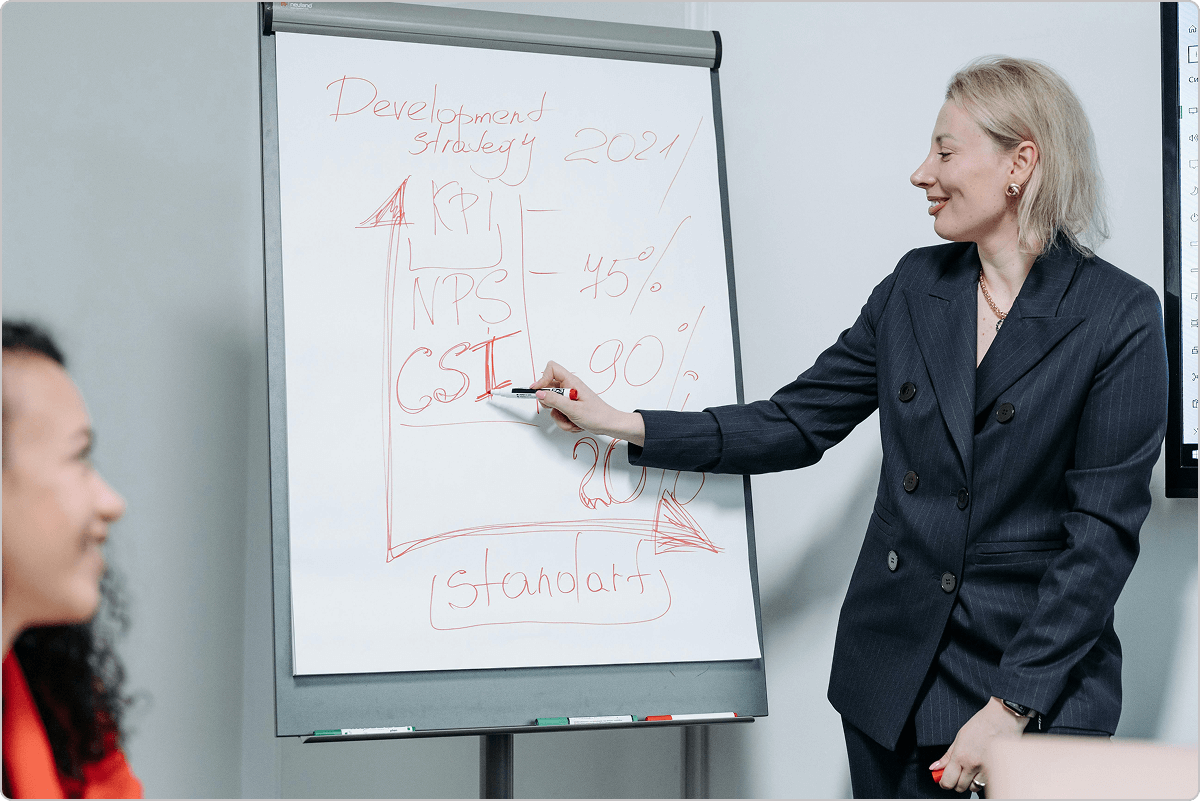 Source: Pexels
Value stream management enables weekly decisions, targets, and funding updates, rather than quarterly updates. KPIs remain unchanged after joining the loop.
Contemporary PPM tools and value stream management systems integrate data science and simulations for real-time analysis and forecasting, which better link KPIs to actionable outcomes.
Understanding Portfolio KPIs in a Digital Landscape
Instead of focusing solely on project completion, utilize portfolio KPIs to assess business success. Don't treat goals and financing as unchangeable if you can't adjust them.
Just like in digital marketing. KPIs are uniform, allowing progress tracking. Compared to the 38.49% average, industry-specific email open rates enhance data accuracy, allowing you to tailor your email marketing strategy more effectively.
Defining Portfolio KPIs vs. Project-level Metrics
- Portfolio KPIs = results. Consider client satisfaction, time value, cost, and retention.
- Project metrics = outputs. Throughput, speed, on-time delivery, and defects. These metrics are helpful for execution health checks but not for making board decisions.
- In general, portfolio KPIs indicate where to allocate resources, and project metrics show how to enhance performance.
 Source: Envato
Characteristics of KPIs that Stay Relevant over Time
- Customer + economics first: Focus on value created or waste reduced, not action.
- Stable definitions: Checkable definitions, versions and numerator and denominator clarity.
- Balanced set: Pair leading indications (activation and cycle duration) with lagging ones (retention and ROI) to avoid Goodhart's Law.
- Useful thresholds: "Grow adoption, but keep churn below X%."
- Owned and instrumented: Identified owner, active data source, and data update schedule.
The Role of Value Stream Management in Connecting Strategy to Delivery
- Map idea to cash: Map the bottlenecks between the concept and the client from "idea to cash," linking KPI movement to work.
- Bet with the flow: Link epics and funding to KPIs. Bets that don't affect KPIs should be stopped or changed.
- Closing the loop faster: Choices are made weekly rather than every 3 months due to weekly experiments and telemetry readings.
- One source of truth: Shared dashboards that link strategy, tasks, and results focus arguments on actions rather than facts.
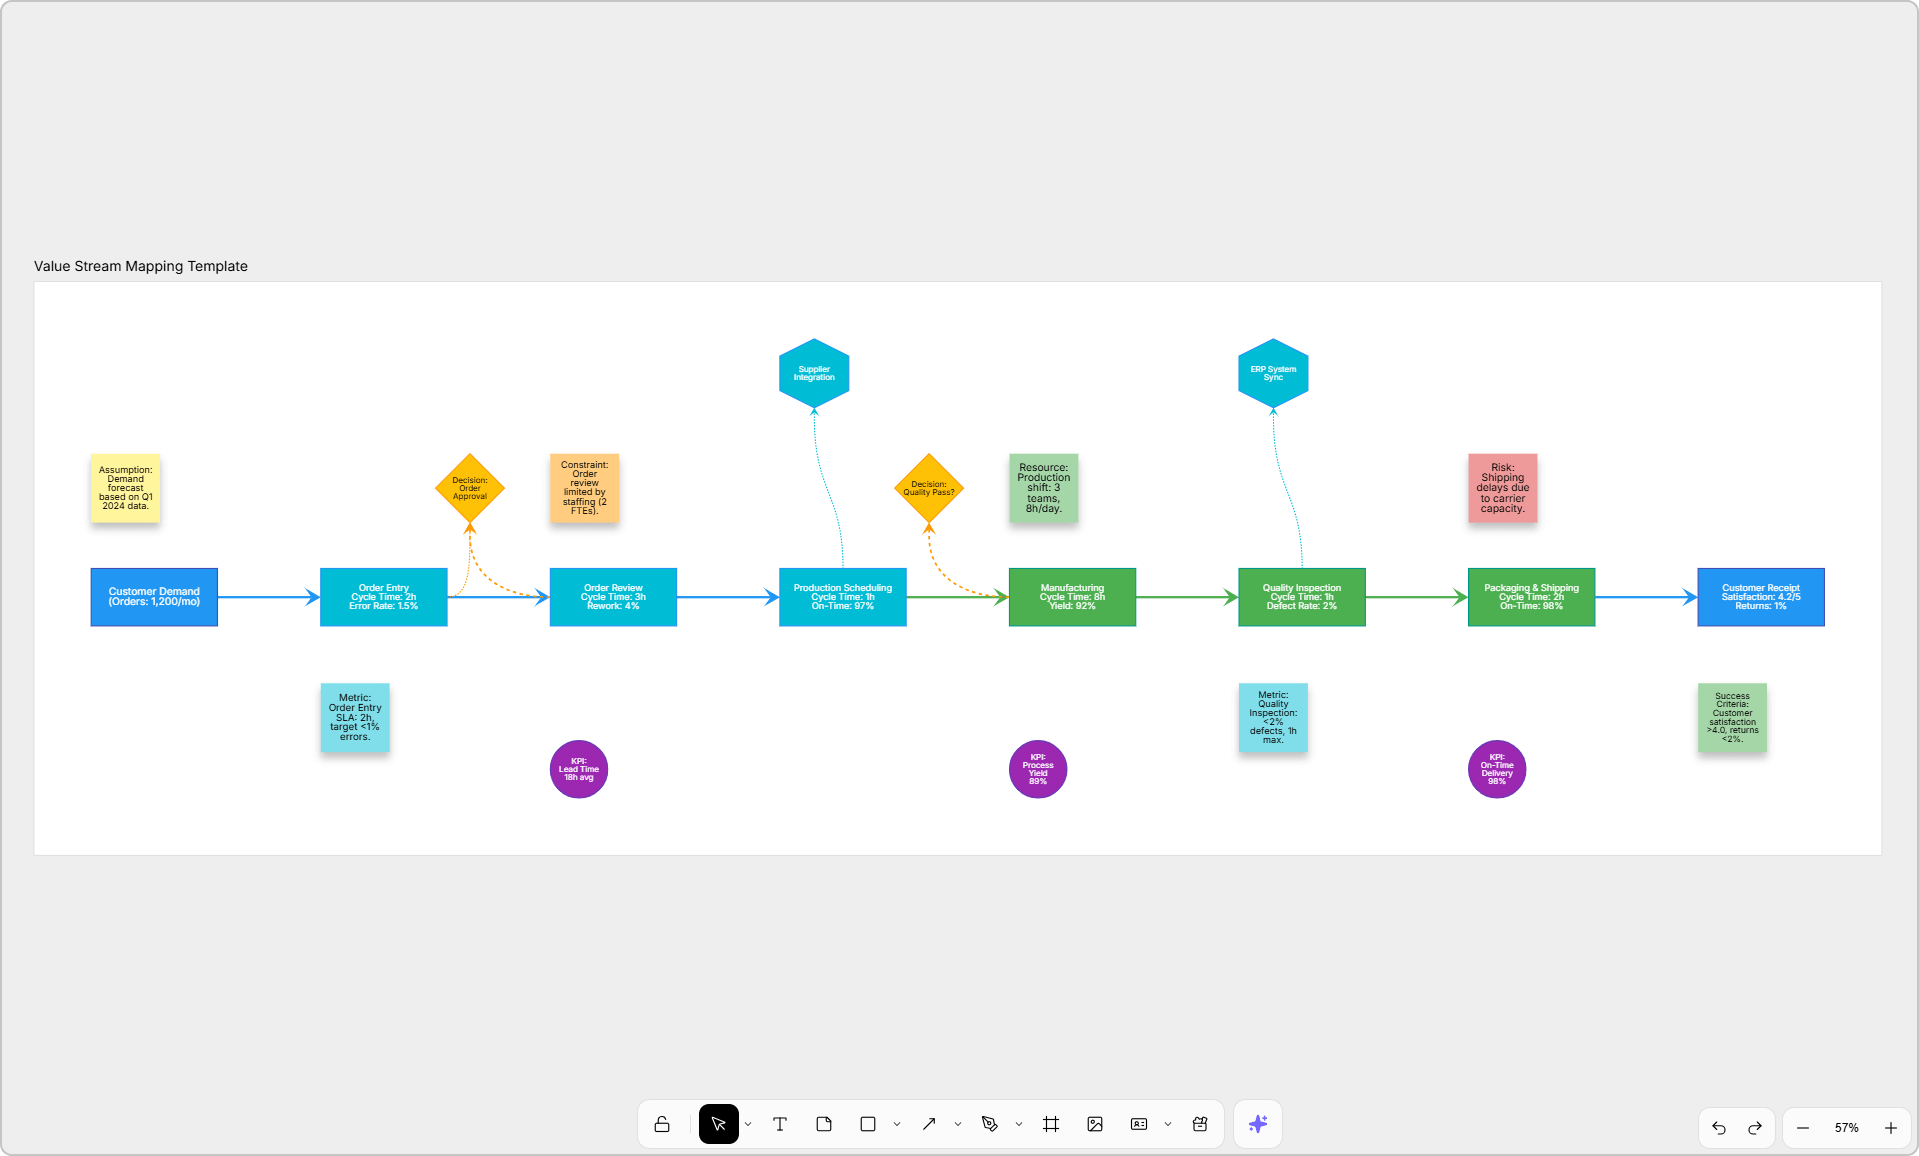 Example of visualizing a production process
The Power of Online Data Science Instrumentation
To sum up, "online" means your measurements change in response to updates to your product, enabling seamless integration. It's too late if understanding shows up tomorrow.
What “Online” Means Today
Standard online stack monitoring is real-time. Releases yield results, not nightly batches. Instantaneous change. Cloud-exclusive services reduce latency and scaling by eliminating deployment interactions.
Key elements: streaming, models, anomalies.
In-flight improvement of clean, versioned data: Clean, organized data from streaming sources provides downstream systems with useful information rather than irrelevant details, keeping them in the loop.
They log every forecast to avoid feedback and notice drifts. Teams use runbooks for seasonal guidance.
Examples of Tools and Technologies Enabling Continuous Insight
- Streaming and Processing: Apache Kafka/Confluent, AWS Kinesis, Google Pub/Sub; Apache Flink, Kafka Streams, Spark Structured Streaming; Debezium for CDC.
- Real‑time Stores and Analytics: ClickHouse, Apache Pinot/Druid, BigQuery (streaming inserts).
- Observability and Telemetry: OpenTelemetry, Prometheus, Grafana.
- ML serving and Monitoring: AWS SageMaker, Google Vertex AI, Ray Serve; Feast (feature store); Evidently AI / Arize / WhyLabs for drift and performance monitoring.
- Experimentation and Feature Flags: LaunchDarkly, Statsig, Optimizely - to tie changes to measurable outcomes fast.
Linking Data Science to Business Outcomes
Quick take: Having data science skills in your portfolio isn't about having nicer dashboards; it's about making faster, better decisions that change funding, goals, and sequencing.
Turning Raw Data into Actionable Intelligence
Events only matter when they affect choices. Minute-long instrument streams should provide signals. Include experiments or near-experiments that illustrate ship, halt, or scale trade-offs. Research that doesn't change a plan or budget is useless.
Mapping Data Signals to Portfolio Objectives
Before investigating reasons, consider "winning" metrics (retention, time-to-value, cost-to-serve).
Every significant investment needs a KPI and regular assessments. Changed signals affect choices.
Without noise after noise.
Case study: Using Predictive Analytics to Anticipate Portfolio Risks
One sample case study is from Thales UK.
The Project Data Analytics Coalition helped Thales UK consolidate 30,000 risk data lines from 100 projects into a single file. In six weeks, they launched "RiskEase," a corporate dashboard, on December 18, 2024.
In 2025, they transitioned to predictive analytics for early detection of potential dangers. It shows how to turn scattered risk data into forward-looking portfolio rules.
Embedding KPIs into Value Streams for Sustainability
KPIs should align with value streams to drive long-term growth and improvement. Integration of KPIs helps measure long-term priorities.
Designing KPIs that Align with Value Stream Management Principles
KPIs matter when they cover the entire value chain, from ideation to delivery. KPIs should track efficiency, quality, and customer impact to assess value flow throughout.
Customer delivery cycles and business goals should guide measurements. Instead of tracking progress, they may improve decision-making.
Integrating Data Flows Directly into Portfolio Value Streams
As businesses grow, data streams become hard to match. KPIs rise with delivery activities, and structured visibility and process discipline have a significant impact on everything.
Value stream information speeds route correction. Data streaming and real-time analytics help teams track KPIs - guaranteed portfolio alignment with strategy goals. Realistic KPIs should replace periodic evaluations.
Modern VSM tools combine strategy, implementation, and metrics. KPIs in value stream management solutions enable companies to optimize their flow, identify delivery bottlenecks, and align changes with business goals. Real-time portfolio learning.
Ensuring Stakeholder Alignment through Transparent Dashboards
Clarify.
Executives, team leads, and stakeholders can understand what's happening through clear dashboards, allowing them to agree on priorities. Seeing the same indicators in real-time makes it easier to set priorities, adjust course, and make quick, informed decisions.
These screens help people collaborate and stay on track with long-term goals.
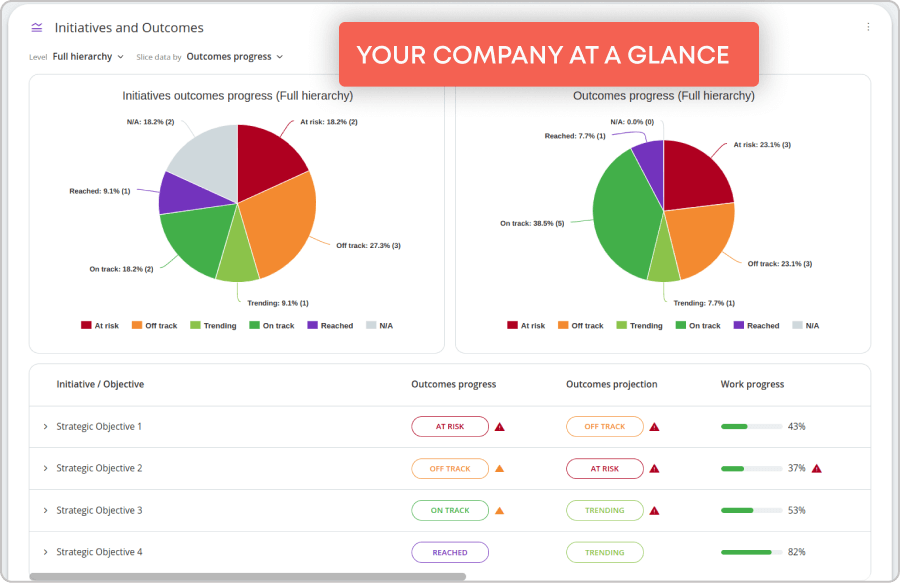 Visualizing workflow reports using Businessmap's Initiatives and Outcomes dashboard
Implementation Roadmap
A successful data science portfolio requires significant time investment. Select the right KPIs, integrate them into your operations, and have growth tools. As technology evolves, data science is advancing rapidly, so your tools must keep pace.
Fastest online data science capabilities apply here. These technologies provide real-time analytics, feedback, and automation to help your teams execute more efficiently while maintaining data accuracy and relevance. By utilizing these tools, you can align your KPI framework with business needs and market realities.
Here's what you need to do.
Step-by-step guide: From KPI selection to instrumentation
- Set goals for your business: First, ensure that KPIs are aligned with long-term objectives, such as time-to-value, customer satisfaction, or income growth.
- Connect key performance indicators (KPIs) to value streams: Ensure KPIs track success throughout the journey - from ideation to delivery - to demonstrate the actual value delivered.
- Select appropriate data sources: Determine where your signs originate (e.g., user actions, system logs, or transaction data) and ensure they are accurate, consistent, and relevant.
- Instrument data collection: To collect data, use tools like Kafka or AWS Kinesis to set up real-time data flows and add telemetry straight to your value streams for live monitoring.
- Automate analysis and alerts: Set up machine learning models and anomaly detection to notify you when KPIs aren't meeting expectations and take necessary action.
Governance and data ethics consideration
- Data privacy: Ensure all customer data is encrypted and that you comply with GDPR, CCPA, and other applicable laws.
- Transparency: Ensure that everyone with a stake in the system can see how data is collected, processed, and utilized. This will help them trust it.
- Fairness and bias: Regularly check machine learning models to ensure they don't inadvertently support biases, especially when using predictive analytics.
Tools for scalable online data science deployment
- Data pipelines: These facilitate smooth data flow and ingestion by utilizing tools like Apache Kafka or Google Pub/Sub.
- Frameworks for machine learning (ML): TensorFlow, PyTorch, or scikit-learn to create and use models that work across your entire business.
- Tool for monitoring: Prometheus and Grafana for real-time viewing and reporting.
- Experimentation platforms: LaunchDarkly or Optimizely for A/B testing and live trial management with flags.
Building a Culture of Data-driven Portfolio Management
Quality KPIs add value, not just measurement. Integrate data science into value streams for real-time, actionable feedback that guides decisions and aligns teams. One takeaway? Let data guide you and include business outcome KPIs.
Online data science and value stream management in business portfolios require further integration and automation to enhance their effectiveness. Real-time telemetry and predictive analytics will enable KPIs to be more responsive to customer behavior, market conditions, and business objectives. Successful data-driven portfolios pivot quickly and invest in what matters.
Businessmap is the most flexible software, helping your company gain visibility across all projects/portfolios, align on goals, and deliver quality work faster.

Imed Bouchrika
Co-Founder & Chief Data Scientist
Imed Bouchrika is a Computer Science professor from the University of Southampton, UK. His work specializes in eLearning, image processing, and biometrics. He contributes to journals, conferences, and IT start-ups.