While data indicates that performance rates vary only slightly among different project management approaches, a PMI study reveals that agile practitioners report the highest project success rate - 75.4%. To understand how organizations achieve such success, we will explore the key charts and tools used in agile reporting.
Understanding Agile Reporting
Agile reporting involves the strategic use of specific metrics and tools to analyze and guide decision-making in work management. This reporting method aims to optimize quality and accelerate the delivery of value - both critical pillars of Agile project management. Agile project managers employ various metrics to monitor progress, boost productivity, and ensure that projects remain aligned with the strategic objectives.
Agile teams use metrics such as lead and cycle time, work in progress, velocity, throughput, success rate, delivery on time, and defects to enhance visibility, measure efficiency, and track performance over time. The choice of these metrics and the reporting method depend on the work methodology adopted by the team.
Plan fast. Adapt faster. Deliver confidently.
Why Is Agile Reporting Important?
Agile reporting supports decision-making, helps achieve outcomes that create customer value, and offers the ability to track progress in real-time. Here are the three critical aspects of Agile reports.
-
Uncovering Insights via Process Outcomes. The outcomes of an Agile project report can uncover process insights (bottlenecks, dependencies, and improvement opportunities) and team performance clues that support informed decision-making. You can also track the progress of projects, programs, or portfolios and map them against planning.
-
Creating Real Customer Value. Creating real customer value can be measured by analyzing how efficient your team is in resolving customers’ issues or how value is delivered over time.
-
Optimizing Service Delivery. Meeting customers’ expectations is a cornerstone of the Agile mindset. Understanding how fit-for-purpose your process is unlocks insights into optimizing your service delivery to increase customer satisfaction and into better future delivery predictions.
Agile Reporting vs. Traditional Reporting
The underlying difference between reporting in traditional and Agile project management lies in the goals, metrics, and constraints of the two approaches.
The Agile philosophy seeks outcomes. It shifts the work ethic toward finding ways to improve customer satisfaction by delivering greater value as a team. The traditional way of work management, however, emphasizes output and helps to answer how people on the team have performed on an individual level.
Traditional leaders often measure a team’s success based on how well a delivery fits in with the budget and time constraints. This approach can be very limiting when discussing outcomes such as creating real value and increasing customer satisfaction. Therefore, reporting in Agile aims to “zoom out” and identify how a team operates as a whole, how efficient the current process is, and how to improve.
The traditional preferred set of metrics for project reporting provides a narrower view of a project’s success. Decision-making is then based purely on specific indicators and their numeric values. In contrast, Agile project managers take into account various factors such as context, actual customers’ problem resolution, process roadblocks, or delivery over time.
7 Essential Agile Reporting Tools
To make the most of your reports, the right tools are your best ally. Today’s market offers a generous choice of tools to help you get real-time reports and draw insights into your work process, team performance, or another indicator of success. Here are seven helpful charts you can start exploring.
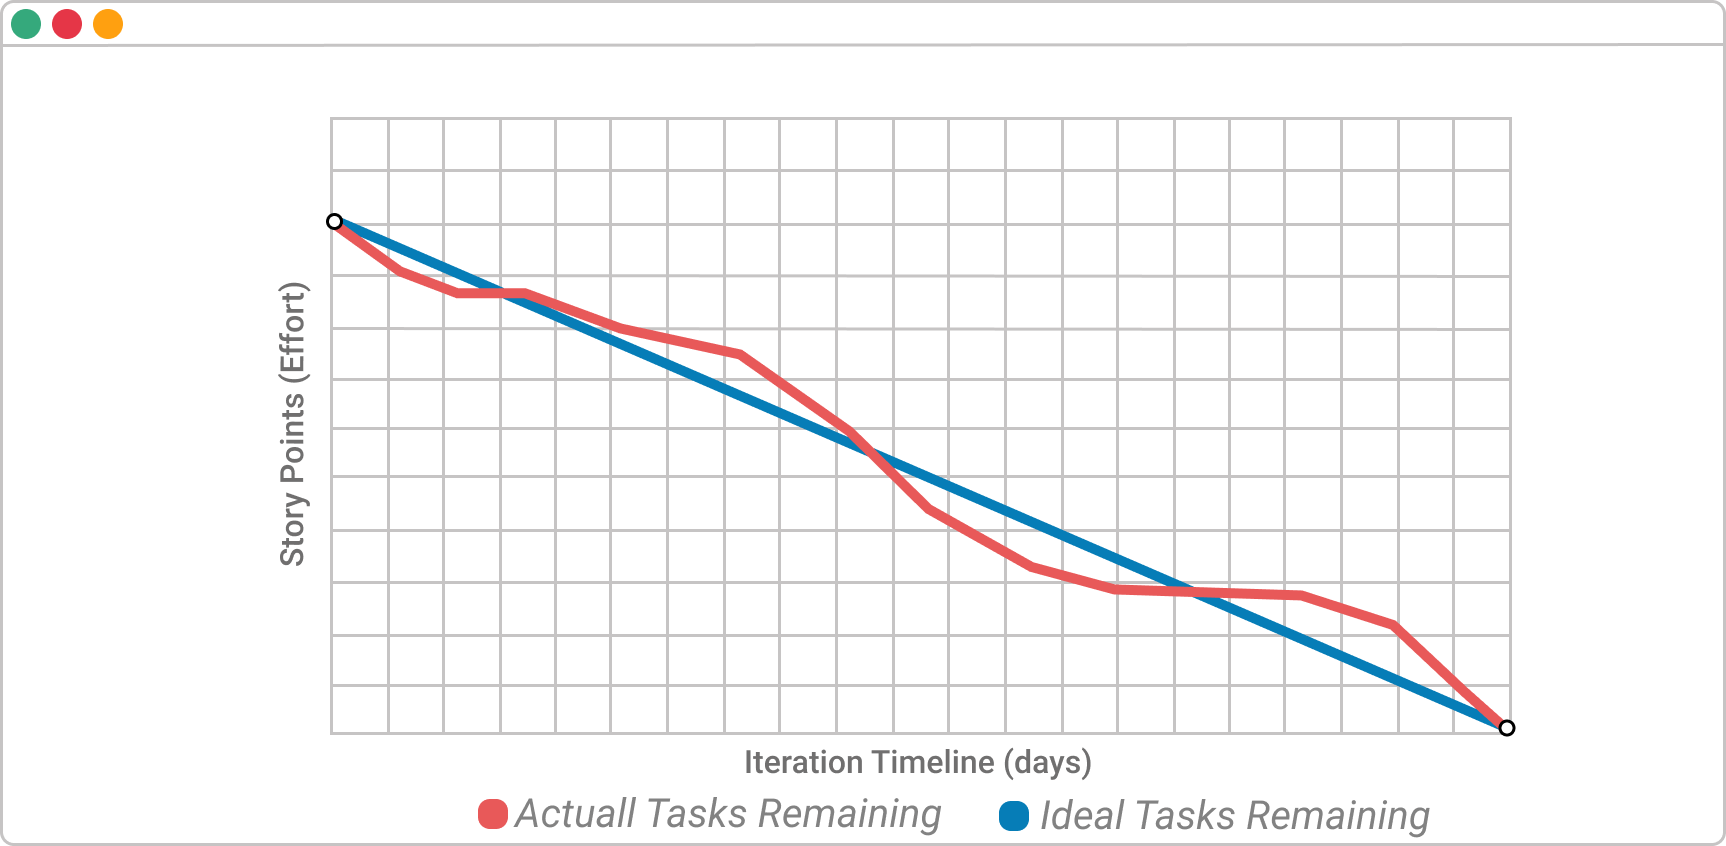
1. Burndown Chart
Scrum teams apply this chart, which helps managers track the number of user stories completed for a given iteration (sprint). The report allows them to predict how many sprints are needed to complete specific pieces of work, such as epics, projects, or themes.
 Burndown chart
2. Velocity Chart
Velocity is an important Agile metric used by Scrum development teams. It represents the average amount of work items that can be completed during a single iteration (sprint). Scrum teams use story points or hours to measure the necessary effort of a user story. Furthermore, tracking velocity in Agile is facilitated by the velocity chart that shows how many story points have been completed in the span of several sprints.
3. Cumulative Flow Diagram
The chart visualizes the total number of work items in every work phase of your process. The dynamics of the different colored bands on the Cumulative Flow Diagram will help you understand how long it takes to complete a work item (average cycle time), if work assignments enter the workflow at the same pace as they leave it (throughput), or how much work is progressing at each work phase (work in progress). Monitoring and analyzing the diagram can help you gain valuable insights on how to stabilize your work process.
Cumulative Flow Diagram
4. Cycle Time Scatterplot
A pillar of efficient reporting in Agile project management is understanding how long it takes to complete a given piece of work. The invaluable chart visualizes all the work assignments a team has completed over a specific period. Furthermore, the insights provided by the Cycle Time Scatterplot allow project managers to make informed decisions based on historical data about work delivery in the future.
Cycle Time Scatterplot
5. Throughput Run Chart
Throughput is one of the fundamental Agile metrics and represents the number of work items passing through a work process over a specific period. Agile project leaders use the chart to understand the real workload capacity of their team and plan better the amount of work that they can deliver for a given time period. A good practice is measuring a team’s throughput rate on a weekly basis.
Throughput Run Chart
6. Aging WIP Chart
Another fundamental reporting mechanism for Agile teams following the Kanban method is the work-in-progress metric. Tools such as the Aging WIP chart (part of some professional Kanban software) facilitate the monitoring of how work assignments move through the work phases of a process. This helps project leaders understand where work is slowing down, delve into the reasons, and improve upon them. Comparing how teams have performed in similar scenarios in the past can lead to new teams or strategic improvement initiatives.
Aging WIP chart
7. Flow Efficiency Chart
To understand better the efficiency of a work process, Lean project managers use the ratio between the value-adding time (actively working on completing the task) and the lead time (the entire time that is required for an assignment to be completed) of a work item. The difference between the two is considered waste and should be reduced. The Flow Efficiency chart, part of some professional Kanban solutions, allows managers to analyze that waste in the work process and improve the team’s efficiency.
Flow Efficiency chart
Best Practices for Efficient Reporting in Agile Project Management
To make efficient reporting, define the goals of your reports, ensure that the intended users can easily understand them, and use them to improve over time.
-
Define the Goals of your Report. One of the main goals of reports in Agile is to assess how your team is performing against the set goals. Do you want to track the progress and team performance, or do you want to predict your team’s delivery pace? This will also help you understand the type of data you want to gather and analyze.
-
Create Reports that are Easy-to-Reach and Understand. Using visualization techniques to share the reporting data with all relevant parties is key to the success of your reporting efforts. Tools such as the Cumulative Flow Diagram, for instance, are ideal for visualizing the key metrics of your team workflow and analyzing its stability.
-
Track Net Promoter Score (NPS). Another good practice applied by Agile product teams is measuring NSP data to evaluate the delivered quality. These actionable insights can help you understand better how satisfied customers are with your product or service and how to improve it.
-
Use the Reported Data. Use the quantitative insights of your reports to provoke conversations in your team or throughout the organization. The information should be used to improve over time and drive change toward delivering work in the most efficient way.
Businessmap is the most flexible software
to achieve full work visibility across teams and portfolios
In Summary
Adequate reporting is critical to the success of every project. Agile management highlights the use of metrics evaluating how much value the work system or process creates, and the level of customer satisfaction that has been achieved. Some of the most prominent tools that facilitate Agile reporting include:
- Burndown and Velocity Charts (for Scrum teams)
- Cumulative Flow Diagram
- Cycle Time Scatterplot


 Burndown chart
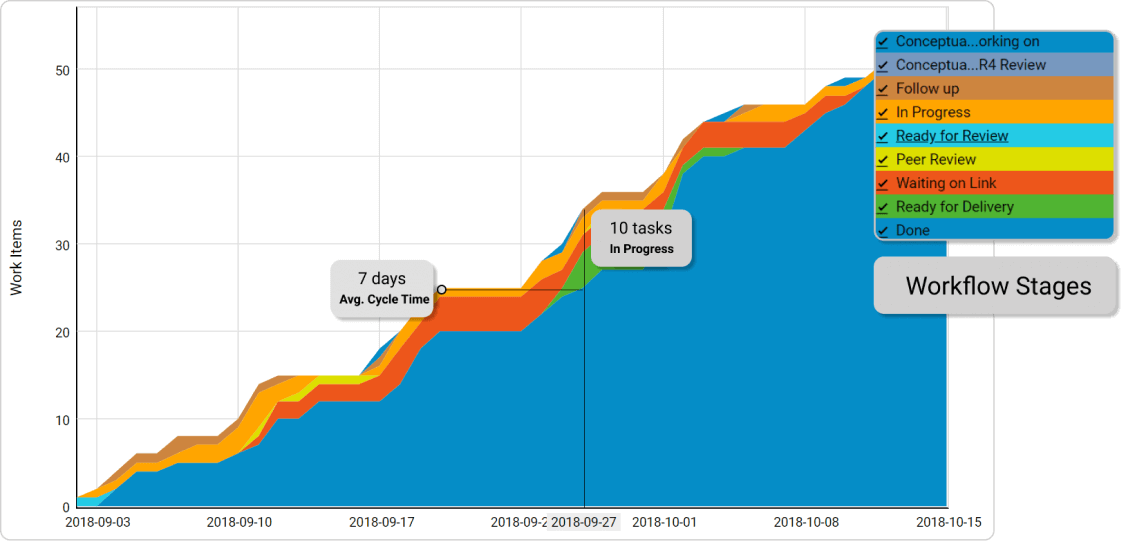 Cumulative Flow Diagram
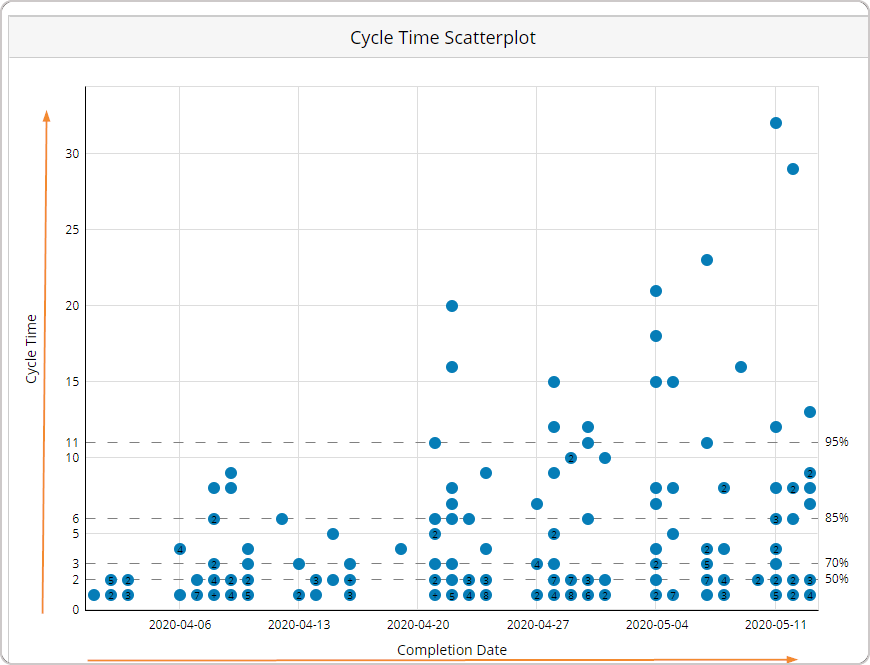 Cycle Time Scatterplot
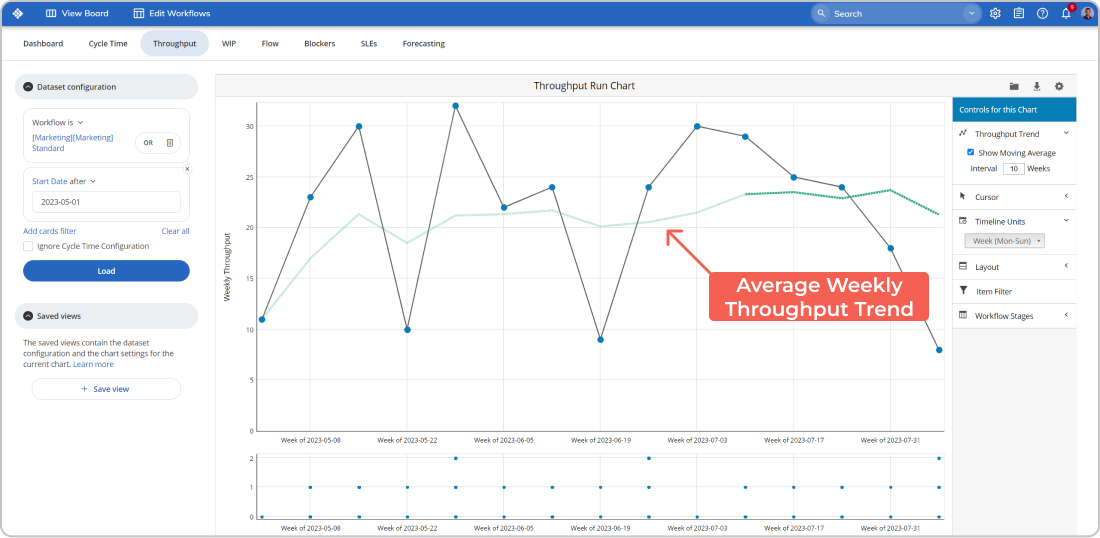 Throughput Run Chart
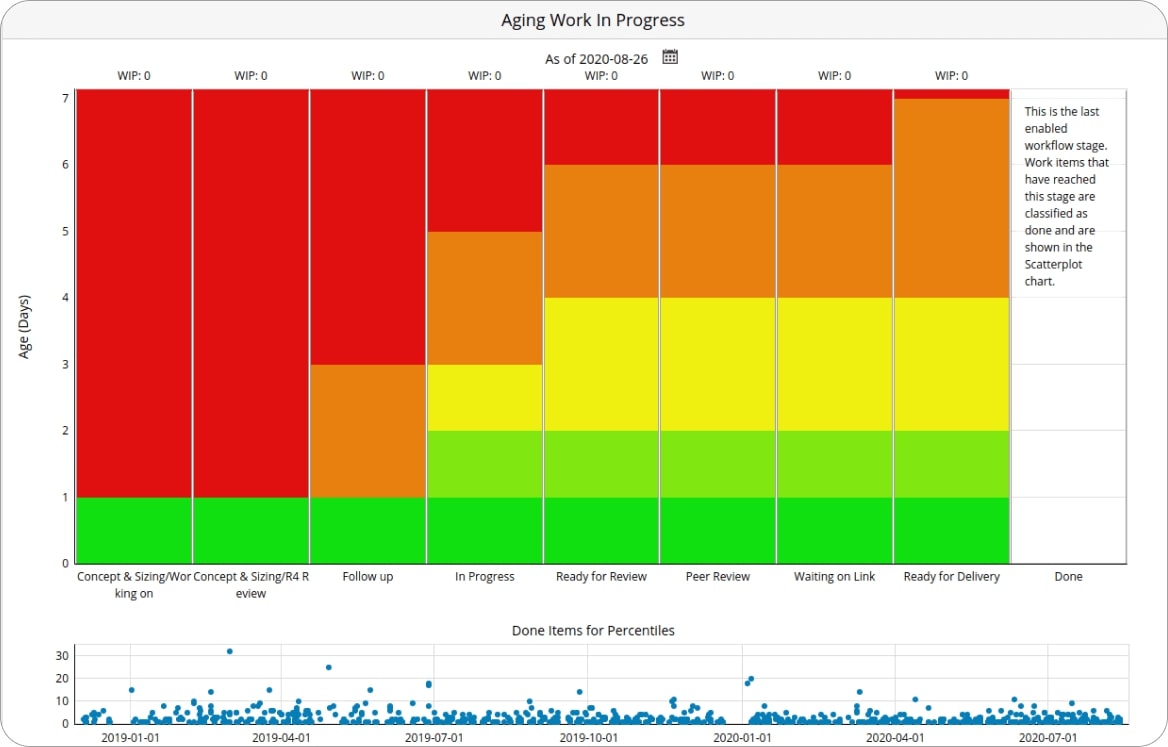 Aging WIP chart
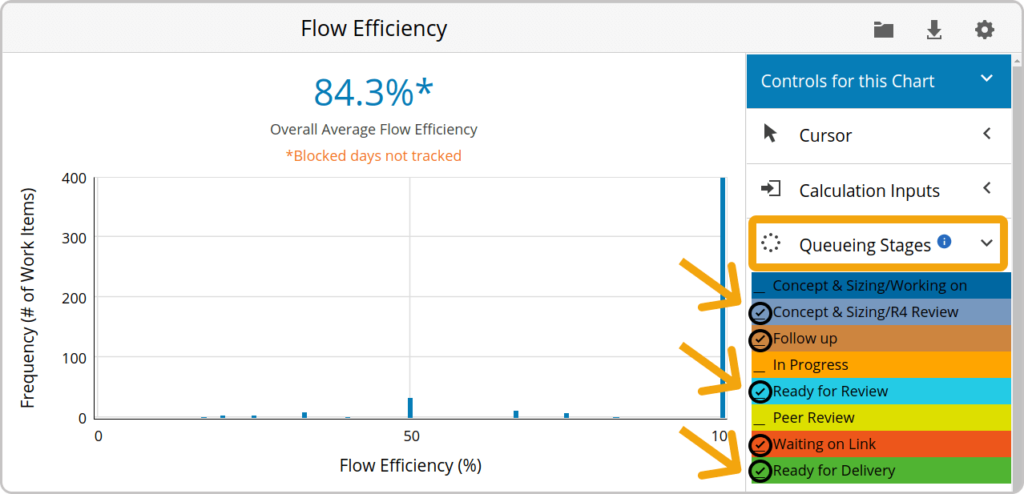 Flow Efficiency chart